600 Strategies, 10 Million Candles, and the Truth About Why Small Traders Lose
by CK
Dedication
For the €526.18 that had the good sense not to move.
Author's Note
Every number in this book comes from real backtesting on real market data from a real broker account. No demo accounts. No hypothetical data. No cherry-picked results. No survivorship bias dressed up as strategy performance.
I ran 600 strategy variations across 5 instruments — EURUSD, GBPUSD, USDJPY, Gold (XAU/USD), and DE30 (DAX) — on over 10 million candlesticks of historical data from Oanda's live price feed. The timeframes ranged from one minute to one month. The indicators ranged from sensible to absurd. The results ranged from depressing to illuminating.
The complete research — every script, every backtest log, every equity curve — is available on GitHub for anyone who wants to verify it, replicate it, or simply confirm that I'm not making this up. I believe that's more than most trading educators have ever offered, which tells you something about the industry.
This is not financial advice. I am not a financial advisor. I am a guy with a €526 brokerage account, a dangerous amount of Python knowledge, and a stubborn refusal to lose money the way everyone said I would.
Chapter 1: The Lambo in My Feed
It was 11:47 PM on a Tuesday, and I was doing what every responsible adult does at that hour: lying in bed, scrolling Instagram with the discipline of a lab rat pressing a dopamine lever.
That is when I met him. Or rather, his content found me — the way all great predators find their prey, through an algorithm that knew I had been Googling "passive income" at 2 AM the previous Thursday.
He was twenty-three. He was in Dubai. He was leaning against a matte-black Lamborghini Huracan with the confidence of a man who had never once questioned whether he deserved to be there. His bio read: "Forex Trader | Mentor | Freedom." His caption said: "50K last month scalping EUR/USD on my phone. DM me FREEDOM for the blueprint."
Fifty thousand euros. In a month. Scalping forex. On a phone.
I put my phone down on my chest and stared at the ceiling. I had an actual company. Actual employees. Actual invoices I was chasing, actual VAT filings I was dreading, actual conversations with actual accountants about actual money that actually existed. And this kid — this kid with a jawline sharper than his understanding of monetary policy — was supposedly making more in a month than most Europeans see in a year, all by tapping a screen while sitting next to a car that cost more than an apartment in Tallinn.
I picked the phone back up. Of course I did.
His grid was a masterclass in aspiration porn. Private jets (window seats only, never the cockpit — so chartered, not owned, but the audience wouldn't know the difference). Rooftop pools. A Rolex that caught the Dubai sun so perfectly you could practically hear the photographer saying "tilt your wrist a little more." Screenshots of MetaTrader — always green, always showing five-figure profits, always conveniently cropped so you couldn't see the account balance, the drawdown, or anything resembling a losing trade.
Forty-seven thousand followers. Comments full of fire emojis and "king" and "teach me, bro." A link in bio to a Telegram channel. And a course. Always a course.
I should have closed the app. I should have gone to sleep. Instead, I did the thing that every person reading this book has done at least once: I tapped the link.
His Telegram channel was free. That's the first trick — always free at the gate. Like a drug dealer who knows the first hit doesn't cost anything. The channel had twelve thousand members and a pinned message: "Welcome to the family. Signals drop at market open. Follow the plan. Trust the process." Trust the process. The battle cry of every person who doesn't want you to examine the process too closely.
The signals looked legitimate, or at least they looked like what a person who had never seen a legitimate signal would imagine a legitimate signal looks like. "BUY EURUSD @ 1.0845, SL 1.0820, TP1 1.0870, TP2 1.0900." Numbers. Precision. The appearance of science. Beneath each signal, the replies rolled in: "In!" "Taken!" "Let's go!" A community of believers, reinforcing each other's faith with every green candle, silent during every red one. Nobody screenshots a loss. Nobody posts "well, that wiped out my last three wins." The channel was a highlight reel masquerading as a track record.
I scrolled back through the history. Wins were celebrated with charts and arrows and annotations. Losses were mentioned in passing — "SL hit, part of the game, next one coming" — and immediately buried under the next signal. If you counted carefully, which I did, because I am the kind of person who counts carefully, the win rate was about 55%. Which sounds decent until you realize the stop losses were consistently wider than the take profits, which means a 55% win rate on a 1:0.8 risk-reward is a slow, polite way of going broke. But nobody was counting. Nobody ever counts.
Then came the friend.
Everyone has this friend. If you don't, then you are this friend, and I say that with love.
Mine was Markus. Good guy. Smart, actually — mechanical engineer, the kind of person who could calculate load-bearing tolerances but somehow couldn't calculate that a 90% win rate on ten-dollar trades and a 10% loss rate on five-hundred-dollar trades is not, in fact, a profitable system.
"Bro," he said, and any sentence that starts with "bro" in the context of financial markets should be treated with the same suspicion as a stranger asking you to hold their bag at the airport. "Bro, I'm using these Telegram signals. Made eight hundred euros last week."
He showed me his phone. Screenshots. Green numbers. Little celebration emojis next to each trade. It looked real. It looked easy. It looked like money was just lying on the ground and all you had to do was pick it up, and the only reason everyone wasn't rich was because they were too stupid or too scared to bend over.
"Who runs the channel?" I asked.
"Some guy. He used to work at a bank or something. Goldman, maybe. Or Deutsche Bank. One of those."
"Which one?"
"Does it matter?"
It matters. It always matters. But Markus didn't want to hear that, because Markus had made eight hundred euros and eight hundred euros was real and my skepticism was theoretical. You cannot argue with a screenshot. You cannot reason someone out of a position they were emojied into.
I asked him if he'd tracked his total — deposits, withdrawals, net performance. He hadn't. He'd been trading for four months and had deposited three thousand two hundred euros total. He'd withdrawn zero. But he'd made eight hundred euros last week, and that was the only number that existed in his universe.
Markus is not an idiot. Markus is a human being, and human beings are spectacularly bad at tracking losses and spectacularly good at remembering wins. Every gambler at every casino in every city on Earth has a story about the time they won. None of them lead with the aggregate.
Six months later, Markus would tell me — quietly, over a beer, in the tone of voice people use when they're confessing something — that he had lost four thousand euros total. Net. After all the deposits and all the signals and all the "bro, I'm crushing it" texts. Four thousand euros, gone. He didn't post about that on Instagram. He didn't send me a screenshot. He just said "I'm done with that" and changed the subject, and I let him, because what else do you say? I told you so? Nobody wants to hear that. Nobody has ever been comforted by being told they were predictable.
But I'm getting ahead of myself. At this point in the story, Markus was still winning. Markus was still sending screenshots. And I was still watching.
Meanwhile, YouTube had decided I was a mark.
The algorithm, having observed my one moment of weakness on Instagram, concluded — correctly — that I was the kind of person who might click on a video titled "How I Turned $500 Into $50,000 In 30 Days (Step-By-Step Strategy)." And there it was. Autoplay. A guy in a rented office with a ring light and a screen share, drawing lines on charts with the authority of Moses parting the Red Sea.
The video had 2.3 million views. The comment section was a marvel of modern fiction:
"This literally changed my life. I quit my job after watching this."
"Made $4,200 in my first week using this exact strategy. God bless you, sir."
"I was skeptical but now I'm a full-time trader thanks to you. My family thanks you."
Definitely not bots. Definitely not paid reviews. Definitely not the same three content farms in Bangladesh cycling through VPNs. These were real people whose lives were really changed by a YouTube video about drawing lines on charts. Sure.
But here is the thing about lies: they don't need to convince everyone. They just need to convince enough people. And "enough people" is a terrifyingly low bar when the lie is "you can get rich without working hard" and the audience is everyone who has ever felt underpaid, undervalued, or stuck.
The YouTube ads were even better. Unskippable, five-second hook: "What if I told you that the strategy banks use to make billions is available to anyone with a phone and five hundred dollars?" What if you told me that? I would tell you that banks make money through market-making, proprietary trading desks staffed by PhDs, high-frequency infrastructure co-located at the exchange, and balance sheets the size of small countries' GDPs — not through a mobile app with a 1.4-pip spread. But that doesn't fit in a five-second hook, does it?
Then the courses.
Oh, the courses.
$997 was the entry point. The "basic" package. You got video modules, a PDF, and access to a Discord server where other people who had paid $997 could collectively not make money together. Camaraderie in financial ruin.
$2,997 was the "advanced" package. Same videos, plus a weekly live session where the guru would trade in real time, except the screen share always seemed to buffer during the losing trades and the connection was miraculously crystal clear during the winners. Funny how that works.
$5,997 was the "mentorship." One-on-one calls. Personal guidance. The promise that this was "investing in yourself." Which, sure, in the same way that throwing $6,000 into a volcano is technically "investing in geology."
"Limited spots available." Always limited spots. The countdown timer on the landing page. The fake scarcity. "Only 7 seats left." Refresh the page — still 7 seats. Come back tomorrow — 7 seats. Come back in a month — you'll never guess — 7 seats. The number 7, apparently immortal.
The testimonials. Before-and-after photos. "I was working at Tesco. Now I trade from Bali." The implication being that Bali and financial success are the same thing, when in reality Bali is where you go when you want to live cheaply enough that your dwindling trading account lasts another six months while you take photos for Instagram that suggest otherwise.
FOMO. The most powerful force in retail trading, stronger than any technical indicator, more reliable than any moving average crossover, more persistent than any trend. FOMO doesn't need backtesting. FOMO has a 100% hit rate on human psychology.
And here's what makes the whole machine so elegant in its cruelty: every piece feeds the next. You see the Lambo on Instagram. You follow the Telegram channel. You watch the YouTube video. You see the course. Each one normalizes the next. By the time you're staring at a $997 checkout page, you've already been primed by fifteen free touchpoints that all told the same story: this is real, this is possible, this is happening right now, and the only thing standing between you and financial freedom is that "Complete Purchase" button. The funnel isn't selling you trading education. It's selling you hope, packaged in candlestick charts and priced at whatever your credit card limit can handle.
The scariest part? The people selling the dream don't even need to be malicious. Some of them genuinely believe they're helping. They made money once — or they're making money now, from the courses — and they've convinced themselves that their success is replicable, that their method works, that the 95% of their students who fail simply "didn't follow the system." It's not a lie if you believe it. And the human capacity for self-deception, especially when monthly subscription revenue is involved, is absolutely bottomless.
I want to pause here and mention something I didn't know at the time.
The entire retail trading education industry — the courses, the gurus, the signal sellers — was about to face a reckoning. Hundreds of millions of dollars in FTC settlements. Empires built on teaching people strategies that were mathematically impossible to profit from. I didn't know it yet, but the same dream being sold to me was simultaneously being investigated by federal regulators. More on that in Chapter 9.
Would knowing have stopped me? I doubt it. The pull is too strong. The narrative is too compelling. "Other people fail because they're undisciplined. Other people fail because they don't have a system. Other people fail because they trade on emotion. I am not other people." This is the internal monologue of every single person who has ever opened a brokerage account, and it is wrong approximately 75% of the time, which, if you recall, is exactly the number that was printed on the risk disclaimer that I didn't read carefully enough.
So there I was. 12:30 AM now. Instagram closed but the damage done. The seed planted. The itch that only a brokerage account can scratch.
I opened Oanda.
Creating an account was disturbingly easy. Easier than signing up for a library card. The library, at least, asks you what kind of books you like. Oanda asked me if I understood leveraged products could result in losses exceeding my deposit, I clicked "yes" with the same diligence I apply to cookie consent banners, and thirty seconds later I was staring at a live EUR/USD chart like a surgeon about to perform his first operation, except the surgeon went to medical school and I had watched four YouTube videos and read half a Reddit thread.
There was a risk disclaimer. There is always a risk disclaimer. "75% of retail investor accounts lose money when trading CFDs with this provider." Seventy-five percent. That number was right there, on the page, in a font size that was technically legible if you squinted. Three out of four people who do this thing lose money doing this thing. If a restaurant had a sign that said "75% of people who eat here get food poisoning," you would not eat there. You would not think "well, I'll be in the 25%." You would walk to the restaurant next door. But trading isn't a restaurant. Trading is a dream, and dreams are not subject to food safety regulations.
I read the 75% number. I noted it. And then I did what every single person who has ever read that number does: I decided it didn't apply to me.
I deposited money. Not a lot. Not Markus-level. Just enough to start.
526.18 euros.
That was the number. I remember it exactly because it was everything in my Wise account that wasn't earmarked for something else. Five hundred and twenty-six euros and eighteen cents. The price of curiosity. The cover charge for the most expensive club I'd ever walk into.
I stared at the chart. I stared at the bid-ask spread. I stared at the little green and red candles doing their little green and red candle dance, and somewhere in the back of my brain, the rational part — the part that had built actual systems, actual products, actual things that worked — whispered something.
It whispered: If that dropout with the rented Lambo can do this with a phone, you can do it with actual engineering skills.
That thought. That exact thought. That is the trap.
Not the Instagram ads. Not the YouTube gurus. Not the courses or the Telegram channels or the screenshots of green numbers. Those are just the bait. The trap is the belief that you are different. That the rules that apply to everyone else — the statistics, the probabilities, the cold mathematics of a negative-sum game — do not apply to you, because you are smarter, more disciplined, more analytical, more whatever-you-need-to-tell-yourself.
I was not different.
But I was about to spend a very long time — and build a very impressive machine — proving it.
526.18 euros. Remember that number. We are going to come back to it.
Chapter 2: Building the Machine
I have a problem, and the problem is that I cannot do anything casually.
Some people open a trading account and just start clicking buttons. They buy when the chart looks like it's going up and sell when they get scared, which is the financial equivalent of navigating by "I feel like I should turn left here." These people lose money quickly, learn nothing, and either quit or develop a gambling addiction. Efficient, in a way.
I am not these people.
I am the person who, when faced with the question "can retail traders make money?", does not simply try trading. I am the person who builds an entire autonomous testing laboratory to answer the question with statistical certainty. I am the person who, upon encountering a locked door, does not try the handle — I build a robot that tries every possible key, documents which ones fail and why, and then writes a report about the metallurgical composition of the lock.
This is either my greatest strength or a clinical condition. The jury is out.
Let me take you back to the moment the idea crystallized.
I had been trading manually for about three weeks. I had made some money and lost some money and was roughly where I started, minus the spread costs, which is the financial equivalent of running on a treadmill and paying for the electricity. I was reading charts, watching indicators, feeling things about candles — and the feeling part bothered me.
Because feelings are not data. Feelings are noise. And I was an engineer looking at noise and pretending it was signal, and the only thing worse than being a fool is being a fool who should know better.
I had a trade journal from those three weeks. Actual entries, actual exits, actual reasoning. You know what most of the "reasoning" column said? Things like "looked like support" and "felt overbought" and "strong candle." Felt. Looked. Strong. These are not words that belong in an engineering context. If a structural engineer submitted a report that said the bridge "felt strong" and "looked like it could hold the load," you would not drive across that bridge. You would report that engineer to someone. And yet there I was, using the same vocabulary to make decisions with real money.
So I asked myself a different question. Not "can I make money trading?" but "can anyone make money trading?" And not in the anecdotal, Markus-made-eight-hundred-euros sense. In the rigorous, falsifiable, put-it-through-the-machine sense.
And to answer that question, I needed a machine.
The server came first.
A Hetzner dedicated box in Helsinki, Finland. Why Helsinki? Because Hetzner's Finnish data center is cheap, reliable, and — this part matters — geographically close enough to the European forex servers that latency wouldn't be an issue while being far enough from my apartment that I couldn't unplug it in a moment of frustration.
The server became the foundation. Sixteen gigabytes of RAM. Enough storage to hold years of market data. A static IP address that would become, over the following months, the most active participant in my financial life — running twenty-four hours a day, five days a week, doing the one thing I could never do as a human being: executing without emotion.
Then the bridge. MetaApi — a cloud service that connects to MetaTrader 5, which connects to Oanda, which connects to the actual forex market. Think of it as a chain: my code talks to MetaApi, MetaApi talks to MT5, MT5 talks to the broker, the broker talks to the liquidity providers, and somewhere at the end of that chain, a fraction of a lot of EUR/USD changes hands because my algorithm decided that a 14-period RSI crossing above 30 constitutes a buy signal.
It took two weeks to get the infrastructure stable. Two weeks of debugging API connections at 3 AM, of reading documentation written by people who apparently believed that clarity was optional, of discovering that MetaTrader's idea of a "timestamp" and the rest of the civilized world's idea of a "timestamp" are related only in the loosest sense. Two weeks of wanting to throw my laptop out the window and instead writing another try-catch block.
But it worked. Eventually, beautifully, it worked.
I could now, from my laptop in Tallinn, send a command to a server in Helsinki, which would relay it through a cloud API in London, which would execute a trade on a platform in New York, which would fill against liquidity in God-knows-where. The whole thing took about 400 milliseconds. A human blink takes 300. My machine could open a position in the time it takes you to close your eyes.
I want to be honest about something here: I loved building this. Not because of the money — there was no money yet, only infrastructure costs and a growing AWS bill that I was studiously not looking at. I loved it because this is what engineers do. We take messy, human, chaotic problems and we reduce them to systems. We eliminate variables. We build controlled environments. The forex market is the most chaotic system most people will ever interact with — trillions of dollars, millions of participants, geopolitical events, central bank decisions, and the collective emotional state of every trader on Earth, all compressed into a single price that updates multiple times per second. And I was building a machine to tame it. Or at least to measure it. To take the chaos and run it through six hundred filters and see what came out the other side.
My girlfriend at the time asked me what I was doing on the computer at 1 AM. "Building a trading bot," I said. She looked at the screen — terminal windows, JSON logs, error messages in red. "It doesn't look like trading," she said. She was right. It looked like what it was: software engineering. The most expensive hobby I'd ever picked up, disguised as a financial venture.
Now came the real work: the strategies.
If I was going to answer the question "can systematic trading work for retail traders?" I couldn't just test one strategy. Or ten. Or even fifty. I needed to test everything. Every approach. Every indicator. Every theory that had ever been whispered in a trading forum, published in a technical analysis textbook, or sold in a $5,997 course. I needed to be exhaustive to the point of absurdity, because anything less would leave room for the most dangerous sentence in trading: "Yeah, but you didn't try..."
So I built 600 strategies.
Six hundred. Let that number breathe for a second. Six. Hundred. That's not a typo. I didn't accidentally add a zero. I built, coded, and tested six hundred distinct trading strategies, each with its own entry logic, exit logic, and risk parameters. Each one a tiny autonomous trader living inside my server, ready to analyze market data and tell me whether it would have made money.
Let me walk you through what that actually means.
Thirty standard indicators. Every moving average crossover you've seen on YouTube — SMA, EMA, WMA, HMA, the whole alphabet. RSI, MACD, Bollinger Bands, Stochastic, Ichimoku, Parabolic SAR. The bread and butter. The ones your broker's free education section teaches in Lesson 1.
Fifteen exotic ones. Keltner Channels, TRIX, the Vortex Indicator, the Coppock Curve, the Schaff Trend Cycle, Donchian Channels, the Klinger Oscillator — things the YouTube gurus don't talk about because they're harder to explain in a thumbnail.
Ten combinations. MACD plus Stochastic. Ichimoku plus RSI. Alexander Elder's Triple Screen. RSI plus Bollinger Bands. Every pairing that had been recommended in a book, a forum, or a $997 PDF.
Fifteen price action patterns. Engulfing candles, pin bars, dojis, morning stars, evening stars, three white soldiers, three black crows, inside bar breakouts — the ancient art of looking at the shapes candles make and assigning meaning to them, which is either the purest form of technical analysis or financial astrology, depending on who you ask.
Fifteen statistical models. Z-score mean reversion, volatility contraction-expansion, Heikin-Ashi, linear regression channels, standard deviation breakouts. Things you'd find in a quantitative finance textbook rather than a YouTube thumbnail.
Fifteen smart money concepts. Liquidity sweeps, fair value gaps, order blocks, Wyckoff springs, break of structure, change of character — the new religion of retail trading, coded into algorithms, stripped of the narrative, tested against cold reality.
Six hundred strategies. Every trick in the book — and a few that aren't in any book.
And then the infrastructure to test them properly: session analysis, risk management comparison, parameter optimization, walk-forward validation, out-of-sample testing, Monte Carlo simulations.
Six hundred strategies. Each one automated. Each one ready to process millions of data points and produce a verdict.
I didn't bring a knife to a gunfight. I brought the entire military. I brought six hundred soldiers, each trained in a different martial art, each armed with a different weapon, each approaching the enemy from a different angle.
If even one of them could win, then retail trading was viable. If none of them could, then I'd have my answer.
People asked me why I was doing this. Friends, colleagues, my mother (who still doesn't entirely understand what forex is but is supportive in the way mothers are, which is to say she asked if I was eating enough). The honest answer was complicated. Part of it was intellectual curiosity — the engineer in me genuinely wanted to know the answer. Part of it was stubbornness — I had started something and I was going to finish it, even if "finishing it" meant proving that the whole premise was flawed. And part of it, the part I didn't like admitting, was that I still believed. Somewhere underneath all the rigor and the skepticism and the careful experimental design, there was still a guy who had deposited 526.18 euros into Oanda and thought, just maybe, there was an edge to be found.
That belief is hard to kill. It's the cockroach of financial psychology. You can stomp on it with data, poison it with statistics, nuke it with evidence — and it crawls out from under the refrigerator the next morning, alive and twitching. "But what about this indicator? But what about this timeframe? But what about this combination nobody has tried?"
Fine, I told the cockroach. We'll try them all.
The machine was built. The arsenal was loaded. The data was next.
And the data — ten million candles of it — would change the way I thought about markets forever.
Chapter 3: Ten Million Candles
Here is a number that means nothing until I make it mean something: 10,000,000.
Ten million. Seven zeros. A quantity so large that if each candle were a grain of rice, you'd have enough to fill a bathtub. If each candle were a second, you'd be counting for 115 days straight. If each candle represented a dollar, you would have — well, you'd have ten million dollars, which is precisely the amount of money that approximately zero of my 600 strategies managed to produce.
But I am getting ahead of myself.
Ten million candles. That is how much data I fed to the machine. Not simulated data. Not generated data. Not data from a textbook's appendix or a free CSV file from some website that last updated its dataset during the Obama administration. Real market data. Every single price movement recorded by a real broker, from real liquidity providers, during real market hours, with real people making real decisions with real money.
Let me break that down, because the devil is in the details and the details are what separate my experiment from every backtest you've ever seen on a trading forum.
Five instruments.
I didn't just test one market. I tested five, chosen specifically because they represent the breadth of what a retail trader might actually trade.
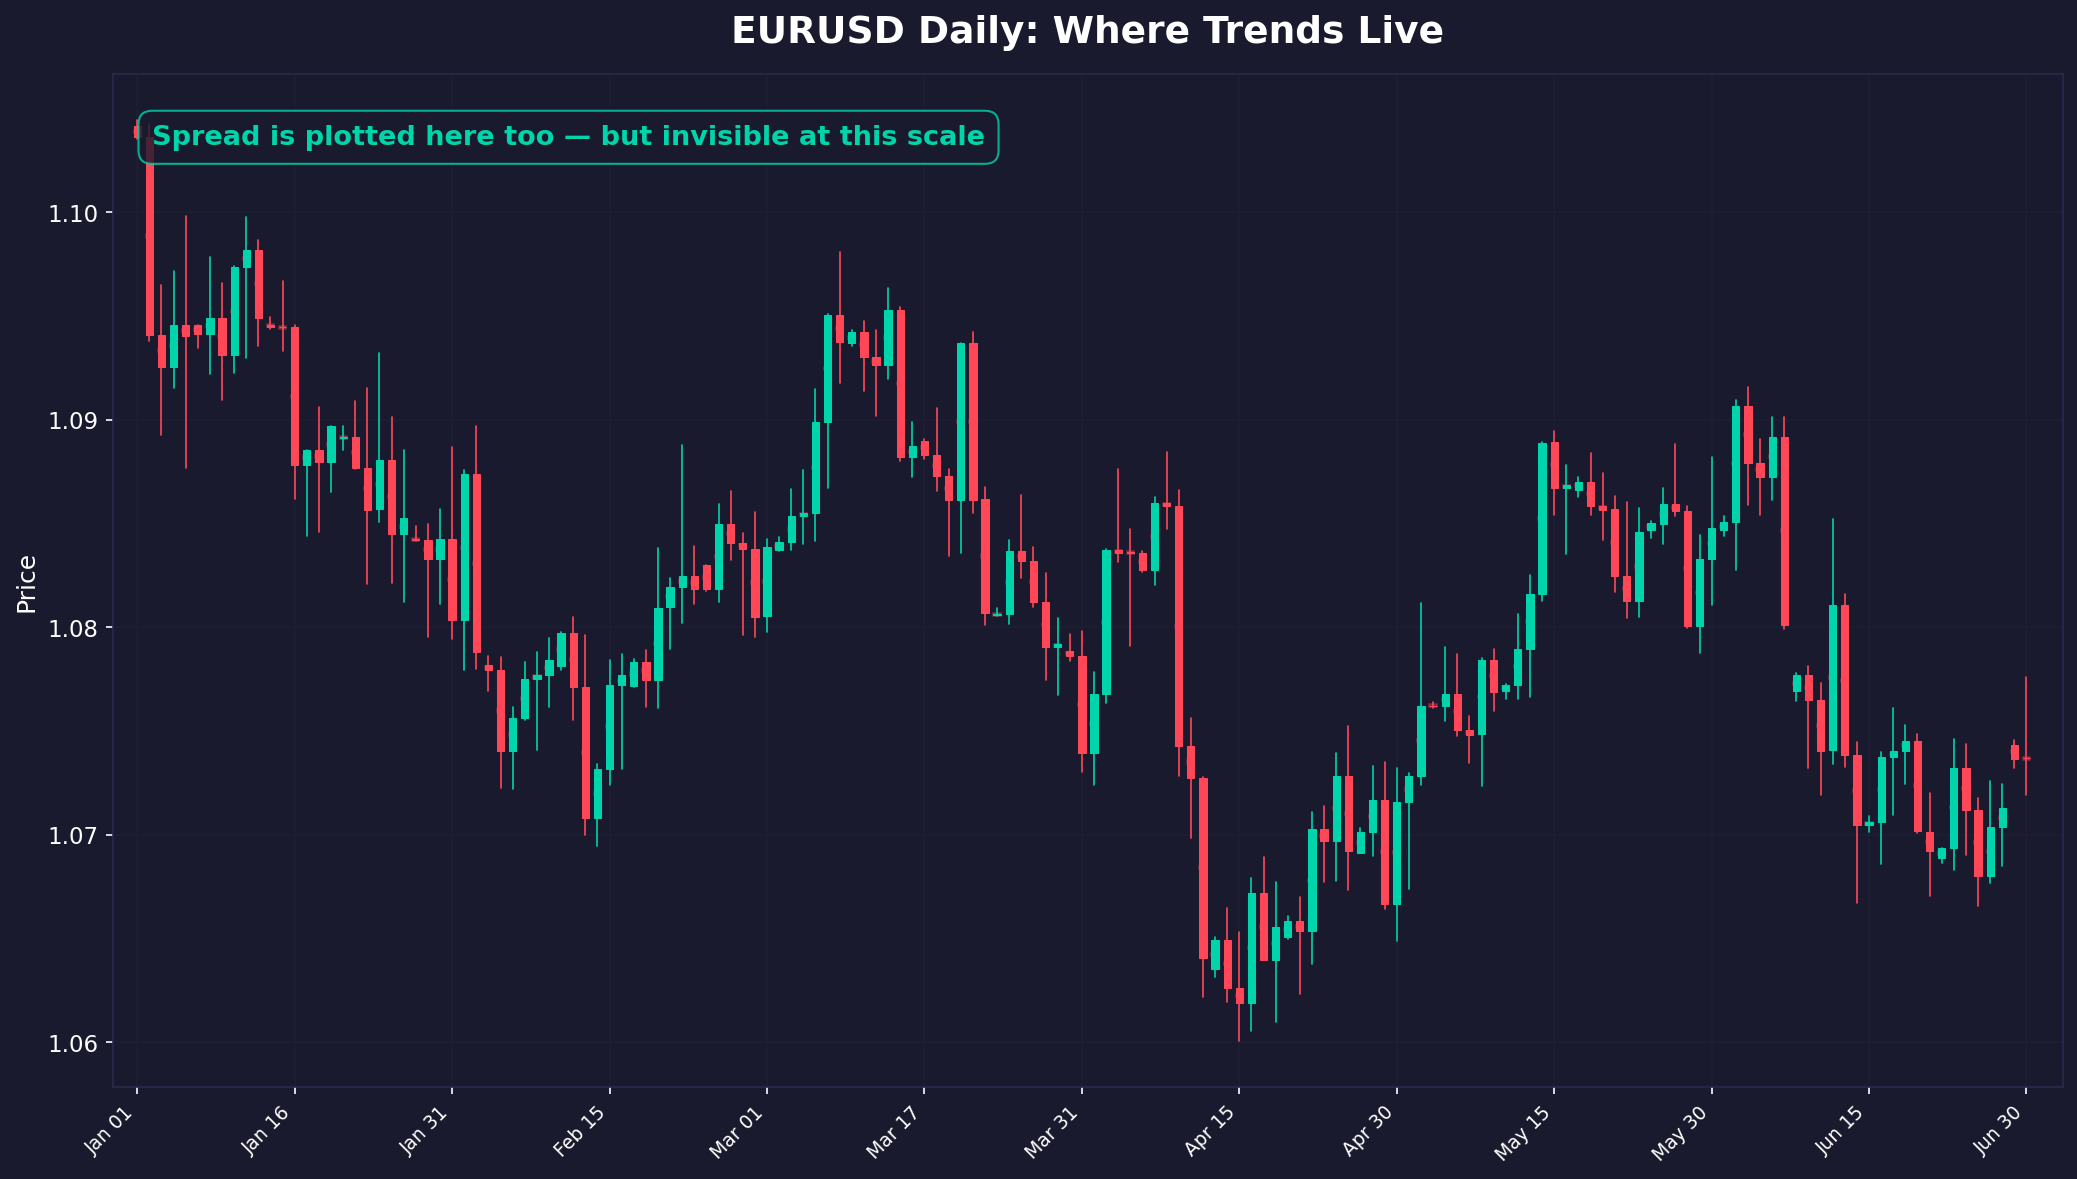
EUR/USD — the most liquid currency pair in the world, the one every beginner starts with, the one that moves like a slow river most days and a flash flood on ECB announcement days. If you can't make money on EUR/USD, you can't make money on anything. That's the theory, anyway.
GBP/USD — Cable, as the old-timers call it, because in the 1800s the exchange rate was transmitted via a literal cable across the Atlantic Ocean. More volatile than EUR/USD, more personality, more tendency to spike 80 pips on a random Tuesday because someone in the House of Commons said something about Brexit that nobody actually understood.
USD/JPY — the yen cross, the carry trade darling, the pair that moves differently from everything else because the Bank of Japan operates on a monetary policy that can only be described as "whatever it takes, and then some." When the BOJ intervenes, USD/JPY doesn't move — it teleports.
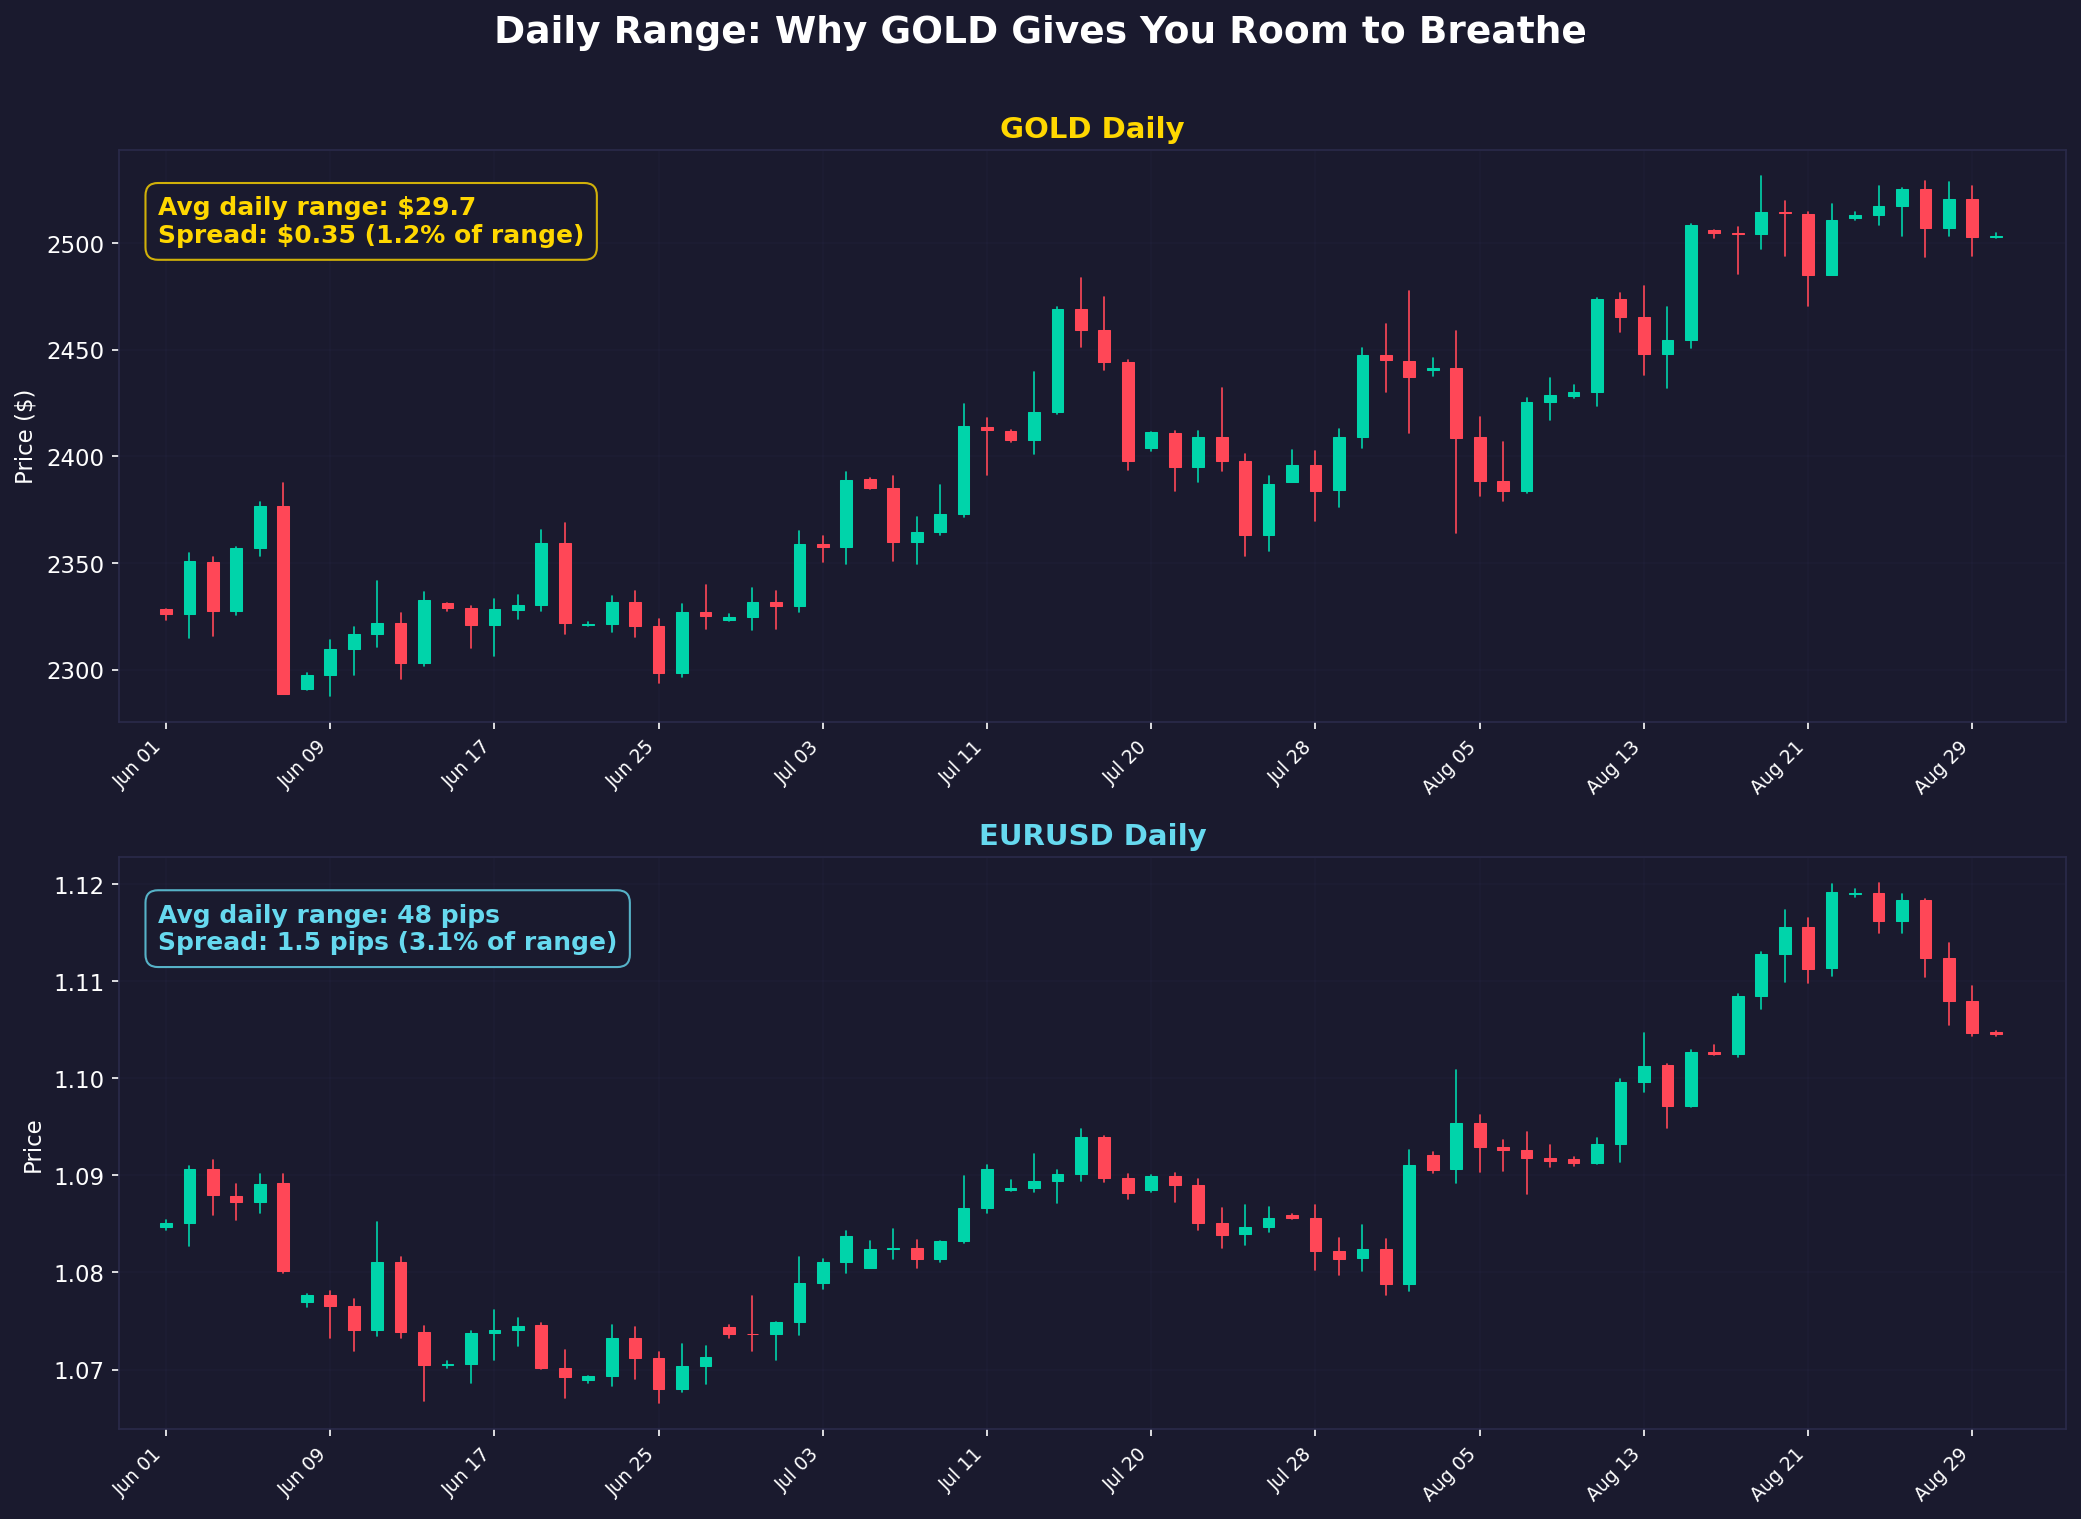
Gold (XAU/USD) — the safe haven, the inflation hedge, the thing your uncle who doesn't trust banks tells you to buy. Gold has a personality unlike any other instrument I tested. It can sit still for three hours and then move $30 in twenty minutes because someone in Washington coughed near a microphone. Volatile, expensive to trade, and beloved by every "smart money" guru who has ever drawn a fair value gap on a chart. Gold's spread is measured differently from forex — it's $0.38 per ounce, which sounds small until you realize that on 1-minute candles, Gold only moves $0.30-0.70. The spread is the move. That $0.38 spread (38 points) on a ~$3,000 instrument works out to just 0.013%, but on short timeframes it's devastating. Gold is also the instrument where the gap between backtest fantasy and live reality is widest, because that $0.38 spread (38 points) eats through profits the way termites eat through wood — silently, invisibly, and by the time you notice, the damage is done.
DAX (the German stock index) — because I wanted to test something that wasn't forex. The DAX trades during European hours, reacts to German economic data, and has a personality best described as "polite but aggressive," which is very German. It opens with a gap most mornings, spends the first hour deciding whether to fill it or run with it, and then largely follows whatever Wall Street's futures are doing for the rest of the day. Trading the DAX as a retail trader is like being a passenger in a car driven by the S&P 500, except you're paying European spread costs for the privilege of the ride.
Five instruments. Five different market microstructures. Five different personality profiles. If a strategy works on EUR/USD but not on Gold, that tells you something. If it works on everything, that tells you something bigger. If it works on nothing — well, that tells you the biggest thing of all.
Six timeframes.
This is where it gets computationally heavy.
1-minute candles. The scalper's playground. Each candle represents sixty seconds of market activity — sixty seconds during which thousands of traders around the world made decisions, algorithms fired, central banks may or may not have intervened, and news headlines either moved markets or didn't. All of that compressed into four numbers: open, high, low, close. Five years of 1-minute data on a single instrument is roughly 1.3 million candles. On five instruments, that's 6.5 million candles on this timeframe alone. Noise on top of noise on top of noise, and somewhere in there — maybe — signal.
5-minute candles. Slightly less noise. Still fast enough that a strategy needs to account for spreads on almost every trade, because when your average profit target is 15 pips and your spread is 1.4, the broker is taking nearly 10% of your profit before you start.
15-minute candles. The sweet spot, according to people who believe in sweet spots. Long enough to filter out the intraday chaos, short enough to catch moves before they're over. The timeframe of choice for every "I trade part-time" mentor who conveniently lives in a timezone where the London-New York overlap falls during waking hours.
1-hour candles. The swing trader's minimum viable timeframe. Each candle is an hour of battle between buyers and sellers, compressed into four numbers. On this timeframe, patterns emerge — or they seem to, which is either the same thing or the worst possible thing, depending on whether the patterns are real or pareidolia.
4-hour candles. Now we're talking about position trading. Each candle is a quarter of a trading day. The noise drops. The signals get clearer. The waiting gets unbearable. A 4-hour trader might get one signal a week, and they had better hope that signal is right, because they've been staring at their screen for five days waiting for it.
Daily candles. The big picture. One candle per day. Five years of daily data is about 1,300 candles per instrument. Not a lot, statistically. But daily candles are what the textbooks are written about, what the institutional analysts look at, what the "serious" technical analysts use while dismissing everyone on shorter timeframes as gamblers, apparently unaware that they're also gambling, just slower.
Six timeframes. Each one a different lens on the same market. Each one favored by a different tribe of traders who are absolutely certain that their timeframe is the right one and everyone else is an amateur.
Five years.
March 2021 to March 2026. Half a decade of market history. This wasn't arbitrary — this window was chosen because it contains everything.
A post-COVID recovery. The inflation spike that caught every central bank sleeping. Interest rate hikes that moved faster than anyone expected. A European energy crisis. A banking scare. Geopolitical events that I don't need to name because you lived through them and you remember the charts. Trending markets, ranging markets, volatile markets, dead markets. Bull runs and crashes and everything in between.
Five years is long enough to see multiple market regimes. A strategy that works in a trending market and fails in a ranging market will reveal itself over five years. A strategy that only works during low volatility will be exposed when volatility spikes. Five years doesn't just test a strategy — it stress-tests it. It puts it through the financial equivalent of boot camp, basic training, and a combat deployment.
And here is something most people don't think about: five years is also long enough to account for luck. In trading, luck is the silent partner. A strategy that "works" for three months might just be riding a trend. A strategy that "works" for six months might be benefiting from a volatility regime that happens to suit its parameters. You need years — multiple years, spanning multiple market environments — before you can begin to separate genuine edge from statistical noise. Even then, you need to apply corrections for multiple testing, which is a fancy way of saying: if you test 600 strategies, some of them will look profitable purely by chance, the way flipping a coin 600 times will produce some impressively long streaks of heads. The question is whether what you're seeing is signal or whether it's just the universe playing tricks on you.
My machine was designed to answer that question. Not with feelings. Not with anecdotes. With math.
Real broker. Real spreads. Real conditions.
This is the part that matters most, and it's the part that 99% of backtests get wrong.
Most backtests use "ideal" data. Close-to-close prices. Zero spread. No slippage. No overnight swaps. No commission. They test strategies in a frictionless vacuum, like a physics problem that starts with "assume no air resistance." And then people wonder why the strategy that returned 400% in backtesting loses money in live trading. Gee, I wonder. Could it be the air resistance?
My data came from Oanda. Real Oanda data. Real Oanda spreads: 1.4 pips on EUR/USD. You know what 1.4 pips means on a 1-minute chart? It means that if your strategy catches a 5-pip move, you're giving up 28% of that move to the broker before you even calculate your risk. On Gold, the spread is $0.38 (38 points). If you're scalping Gold on a 1-minute chart, you need price to move nearly 40 points in your direction just to break even. That's not trading. That's charity.
Every backtest I ran included real spreads. Real swap rates for positions held overnight. Real position sizing with real lot calculations. Real margin requirements. Real slippage estimates based on historical execution data. If my bot entered a trade, it entered it the way a real trade would be entered — with all the costs, all the friction, all the little invisible hands reaching into your pocket.
This is not an academic exercise with perfect data in a vacuum. This is a simulation of what actually happens when a real person presses the buy button on a real broker.
I want to emphasize this because it is the single most important methodological decision I made, and it's the one that separates this experiment from virtually every backtest you'll find online. Go to any trading forum. Find a strategy post with a beautiful equity curve climbing from the bottom left to the top right of the chart. Now look at the fine print. "Spread: 0." "Commission: not included." "Slippage: not modeled." They've tested their strategy in a world that doesn't exist. A world where brokers work for free, where every order fills at exactly the price you wanted, where holding a position overnight costs nothing. Of course the strategy works in that world. I could make a strategy that buys randomly and sells randomly look profitable if I removed all the costs. The costs are the game. The costs are what make it a negative-sum enterprise for retail traders. Remove the costs and you're not testing trading — you're testing arithmetic.
My machine did not have that luxury. My machine lived in reality. And reality, as we were about to discover, is not kind to retail strategies.
The bot.
And then there's the thing executing all of this. My bot. My tireless, emotionless, mathematically precise robot that lives on a server in Helsinki and exists for one purpose: to find out if any of these strategies work.
It doesn't sleep. You sleep. I sleep. The market sleeps on weekends. The bot does not sleep. It processes data at 2 AM and at 2 PM with exactly the same precision. It doesn't get tired. It doesn't get bored. It doesn't start scrolling Twitter during the Asian session because "nothing's moving anyway" and miss the breakout that the strategy was designed to catch.
It doesn't panic. When the market drops 200 pips in 10 minutes because some central banker said a word that nobody expected, the bot doesn't feel fear. It doesn't slam the close button. It doesn't override its stop-loss because "this time is different." It executes the rules. Every single time. Without exception.
It doesn't revenge trade. It doesn't take a loss and then immediately re-enter the market at double the size because it "knows" the market has to come back. It doesn't have an ego. It doesn't need to be right. It doesn't experience the uniquely human agony of being stopped out at the exact low before the market reverses 150 pips in the direction you were right about.
It doesn't get drunk and short the DAX on a Friday night because it had a bad week and the chart "looked bearish" and three glasses of Riesling made the risk-reward ratio seem perfectly reasonable. This happens more than anyone admits. Not to the bot. The bot has never tasted Riesling. The bot has no taste buds. The bot has no emotional relationship with money whatsoever.
It sizes every position mathematically. Risk per trade: exactly 5% of account equity, every time. Not "about 5%." Not "5% but a little more because I really feel good about this one." Exactly 5%. Calculated to the micro-lot. Adjusted for the specific instrument's pip value. Adjusted for the current account balance. Perfect. Every. Time.
The bot is, in short, the best trader that could possibly exist. It has perfect information (within the constraints of the data available). It has perfect execution. It has perfect discipline. It has zero emotional interference. It is the Platonic ideal of a retail trader — the trader that every guru promises to turn you into, the trader that no human being could ever actually be.
And that is the point.
If this machine — this perfect, tireless, disciplined, emotionless, mathematically precise machine running 600 strategies across 10 million candles with real broker data and real spreads and real conditions — if this machine cannot make money, then the problem isn't you.
It's not that you panicked. It's not that you didn't follow your rules. It's not that you need a better indicator, a better course, a better mentor, or a more expensive Telegram channel. It's not that you lacked discipline or education or screen time.
If this machine can't make money, then the problem isn't the trader.
The problem is the game.
Ten million candles. Six hundred strategies. Five instruments. Six timeframes. Five years. One bot that never sleeps, never feels, never flinches.
The machine was loaded. The question was asked. The numbers were about to come in.
And I sat in my apartment in Tallinn, watching the progress bar crawl across my terminal, and for the first time since I'd seen that kid with the Lamborghini on Instagram, I felt something I hadn't expected.
I felt nervous.
Because deep down — underneath the engineering rigor and the statistical methodology and the carefully constructed experimental framework — there was still a part of me that wanted the machine to find something. A part of me that wanted there to be a signal in the noise, a strategy that worked, a mathematical edge that would vindicate the whole enterprise. A part of me that, despite everything I was building to disprove, still wanted to believe.
The progress bar hit 100%.
The results populated.
I stared at the screen. Then I stared some more. Then I opened a beer — not Riesling, I'm not a monster — and I stared a third time, because the numbers didn't change the first two times and I needed to verify they wouldn't change the third time either.
They didn't change.
Six hundred strategies. Ten million candles. Five instruments. Six timeframes. Five years. One machine that did everything right.
And now, for the first time, I had an answer. Not an opinion. Not a feeling. Not a YouTube guru's promise or a Telegram signal's green arrow. An answer, built on more data than most hedge funds use for their initial research, tested with more rigor than most academic papers, and executed with more discipline than any human trader could ever achieve.
What did the numbers say? What happened when you strip away the emotion, the marketing, the FOMO, the Lamborghinis, the ring lights, and the countdown timers, and just let the math speak?
That, reader, is where things get interesting.
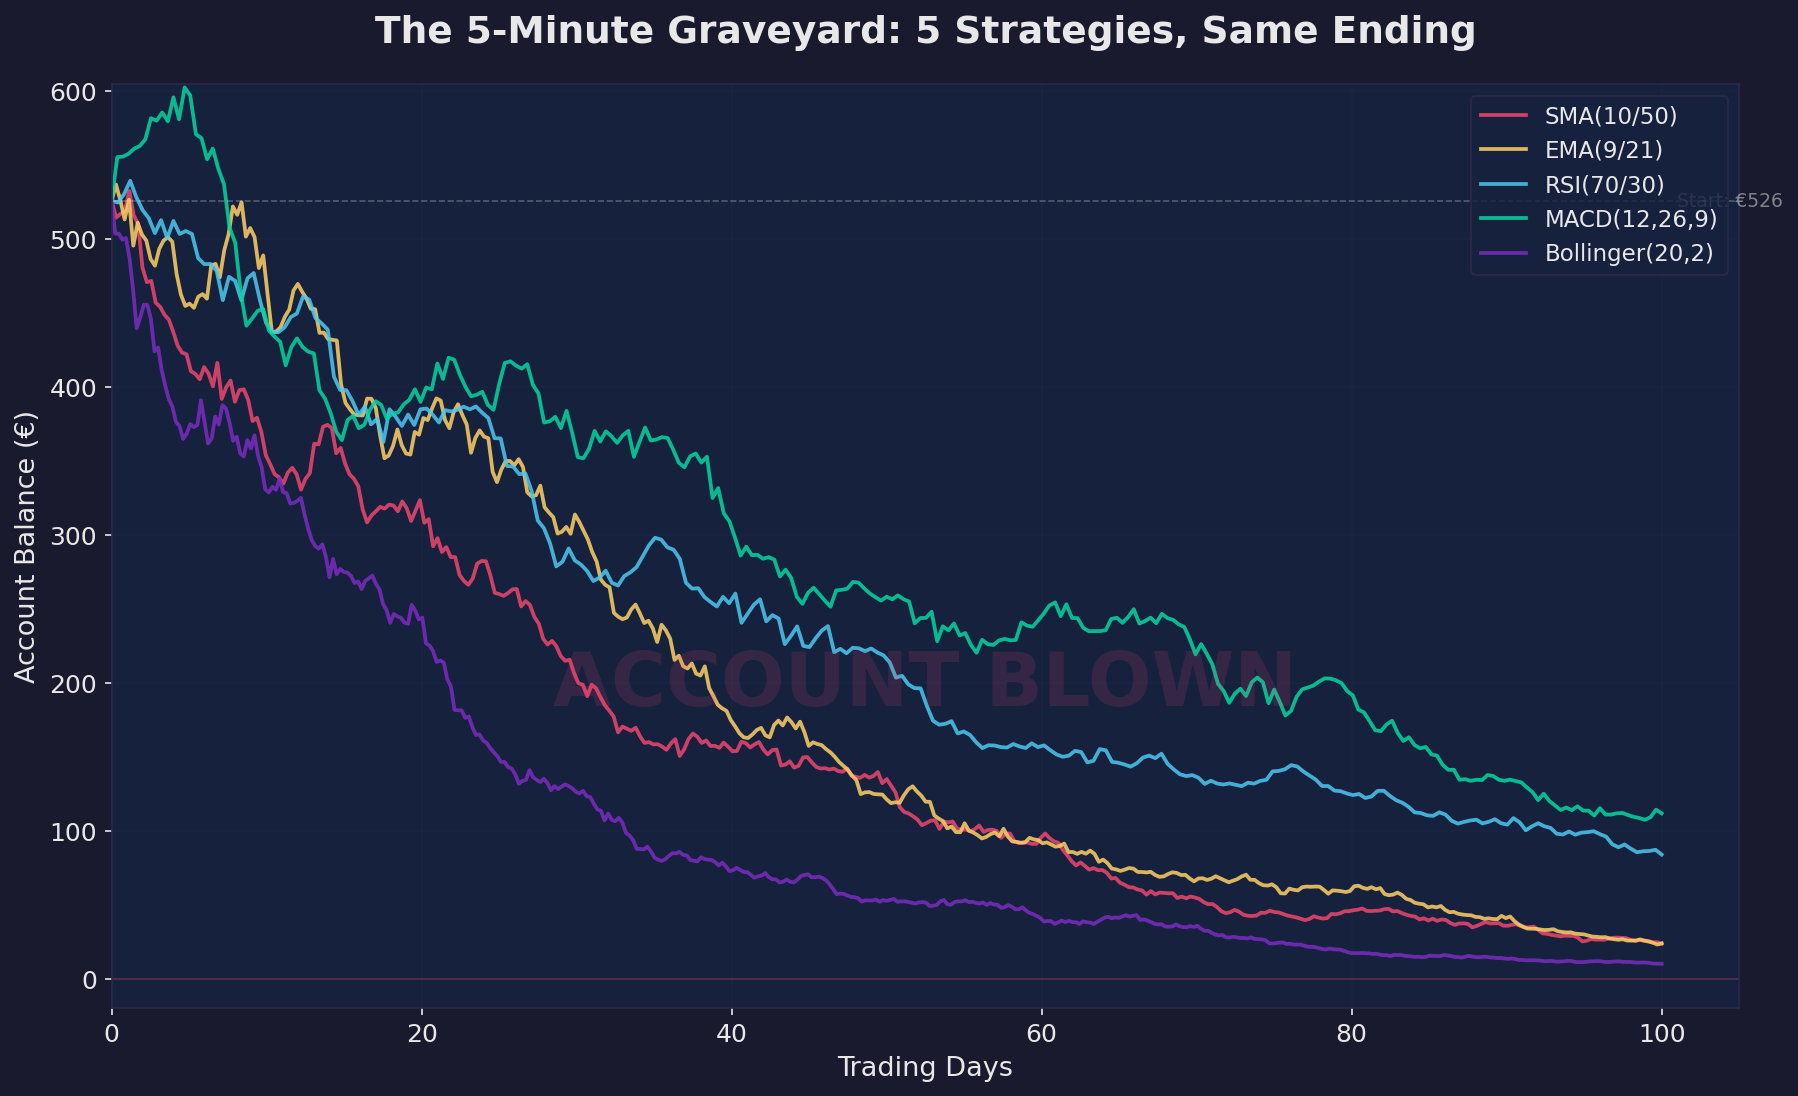
Chapter 4: The Graveyard
I remember the exact moment I pressed "Run."
Not some metaphorical, literary-device version of remembering. I mean I can tell you what was playing on Spotify (some lo-fi playlist I'd convinced myself helped me concentrate), what time it was (2:47 AM, because apparently that's when I make my best decisions), and exactly how the glow of three monitors felt against my face as I launched the first batch of backtests.
Twenty strategies. One-minute EURUSD candles. Two years of tick data cleaned, aligned, and verified down to the millisecond. This wasn't some amateur hour MetaTrader 4 backtest with interpolated data and "every tick (based on real ticks that we made up)" modeling. This was real. Ten million candles of real. Every bid, every ask, every spread fluctuation captured and replayed with surgical precision.
I leaned back. Cracked my knuckles. Took a sip of whatever caffeine delivery system was closest.
And then I watched every single strategy lose everything.
Not most of them. Not "the majority showed promise but needed tweaking." All of them. Twenty for twenty. A perfect score, just in the wrong direction.
Let me give you the numbers because the numbers are the whole point.
EURUSD, 1-minute timeframe: 20 strategies tested.
Every single one lost 100% of the account. Gone. Vaporized. The best performer — and I use that word with the kind of bitter irony usually reserved for describing the Titanic's "maiden voyage" — had a profit factor of 0.66. For the non-traders reading this, a profit factor below 1.0 means the strategy loses money. A profit factor of 0.66 means that for every dollar it made, it lost a dollar fifty. The best one.
The worst ones didn't even get that far. They hit the account floor so fast the equity curve looked less like a chart and more like a cliff face. Straight down. Do not pass go. Do not collect $200. Do not collect anything, ever.
OK. Fine. Maybe EURUSD was a tough market. Let's try something else.
USDJPY, 1-minute timeframe: 20 strategies tested.
All lost. Every one. But this time, I found something that made my stomach drop harder than the equity curves. The spread on USDJPY at the 1-minute level was 137% of the stop-loss distance. Let me say that again in case it didn't land. The cost of entering the trade was larger than the distance at which the strategy said "I'm wrong, get me out."
Imagine you're a boxer, and before the fight even starts, you're already knocked down. Not knocked out — that would be merciful. Knocked down. You can get back up. You can fight. But you start every single round from your knees. And your opponent? He starts standing. Every time. For every round. Forever.
That's what 137% spread-to-SL looks like.
Gold (XAUUSD), 1-minute timeframe: 15 strategies tested.
All lost. The spread-to-stop-loss ratio? One thousand two hundred and fifty percent.
1,250%.
That's like paying a $12.50 toll on a $1 road. That's like buying a $1 coffee and the barista charging you $12.50 for the cup. On Gold 1-minute, you could have the single greatest trading strategy ever devised by human or machine intelligence, a strategy whispered to you by a time-traveling Warren Buffett riding a unicorn made of pure alpha, and it would still lose money. The math doesn't allow it. You'd need a strategy that's right more than 93% of the time just to break even. Not to profit. To break even.
Nobody has a 93% win rate on 1-minute Gold. Nobody has ever had a 93% win rate on 1-minute Gold. Nobody will ever have a 93% win rate on 1-minute Gold. If someone tells you they do, they're either lying, selling a course, or both. Probably both.
GBPUSD, 1-minute timeframe: 20 strategies tested.
Two showed a positive return. Two! For about thirty seconds, my heart rate spiked. Then I looked at the trade count. One had 6 trades. The other had 4.
Six trades. Over two years of data.
That's not a strategy. That's a coincidence. That's flipping a coin six times and getting heads five times and calling yourself a "heads specialist." With fewer than 7 trades, you have zero statistical significance. You have nothing. You have noise dressed up in a strategy's clothing.
DE30 (the German stock index), 1-minute timeframe.
One strategy showed a return of +118,870%.
I stared at it for a full minute. Then I started laughing. Not a happy laugh. The kind of laugh you do when you've been awake for twenty-two hours and the universe presents you with something so perfectly ridiculous that crying seems like too much effort.
It was a compounding artifact. A rounding error amplified by the backtest engine. Ghost profits. I removed it from the results. It wasn't real.
Here's the thing that kept me awake that night. It wasn't that the strategies were bad. I'd spent weeks building them. Carefully. Methodically. Using every serious indicator, every legitimate pattern, every combination of entry and exit logic that the academic and professional trading literature suggested might have an edge. These weren't garbage strategies. These were the best I could build. The best anyone could build, given the tools available to a retail trader.
And they all died on 1-minute charts.
So I started digging into why. Not emotionally — I was past the emotional stage, firmly into the "scientist who just watched their hypothesis explode in the lab" stage. I pulled up the raw numbers.
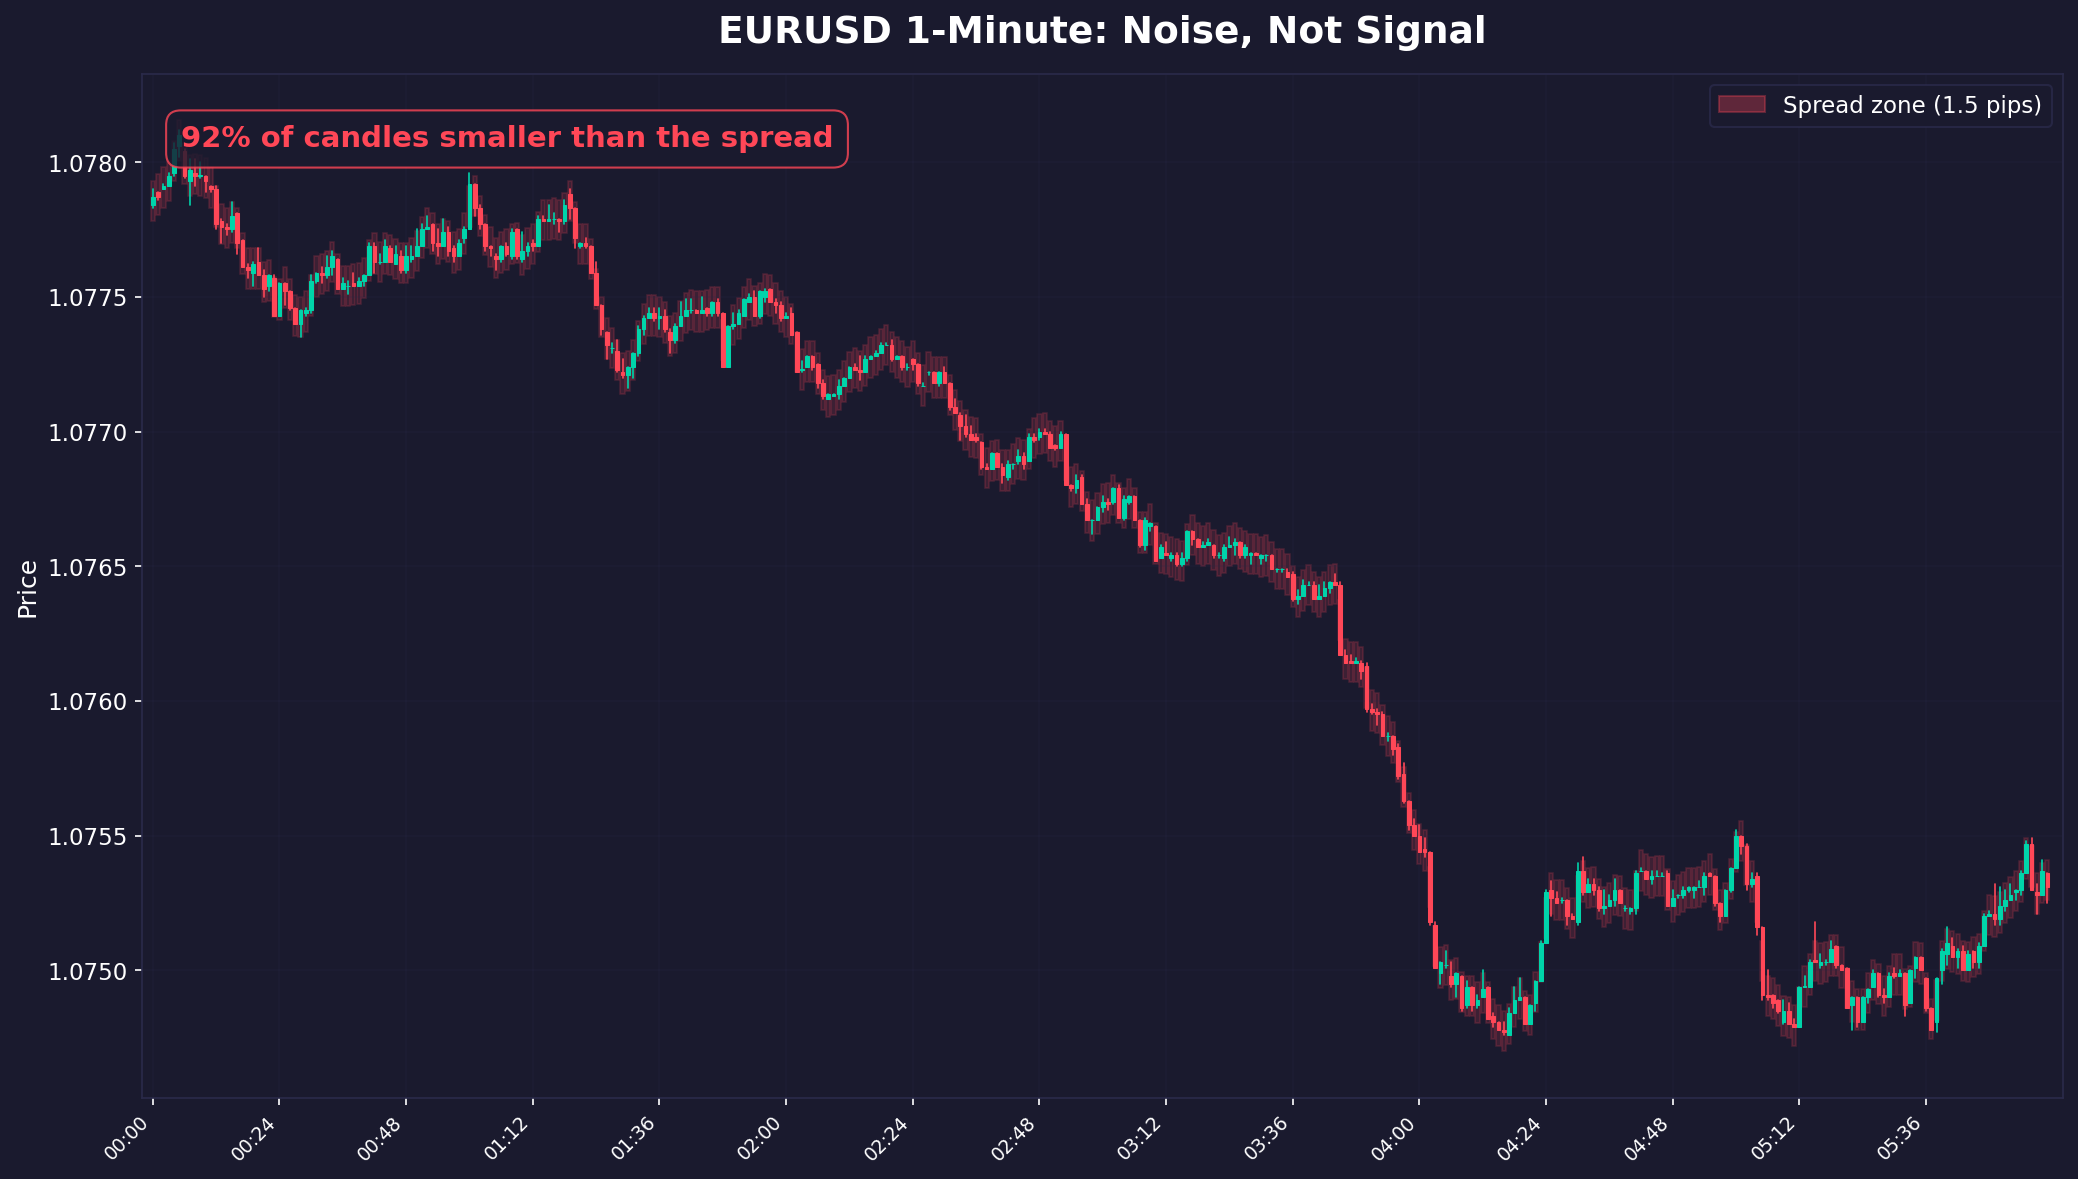
On 1-minute EURUSD, the average candle range — the Average True Range, the ATR, the amount the price typically moves within one minute — is 1.3 pips.
The spread — the cost of entering a trade — is 1.4 pips.
Read that again. The cost of entering the trade (1.4 pips) is larger than the amount the market typically moves in that time period (1.3 pips).
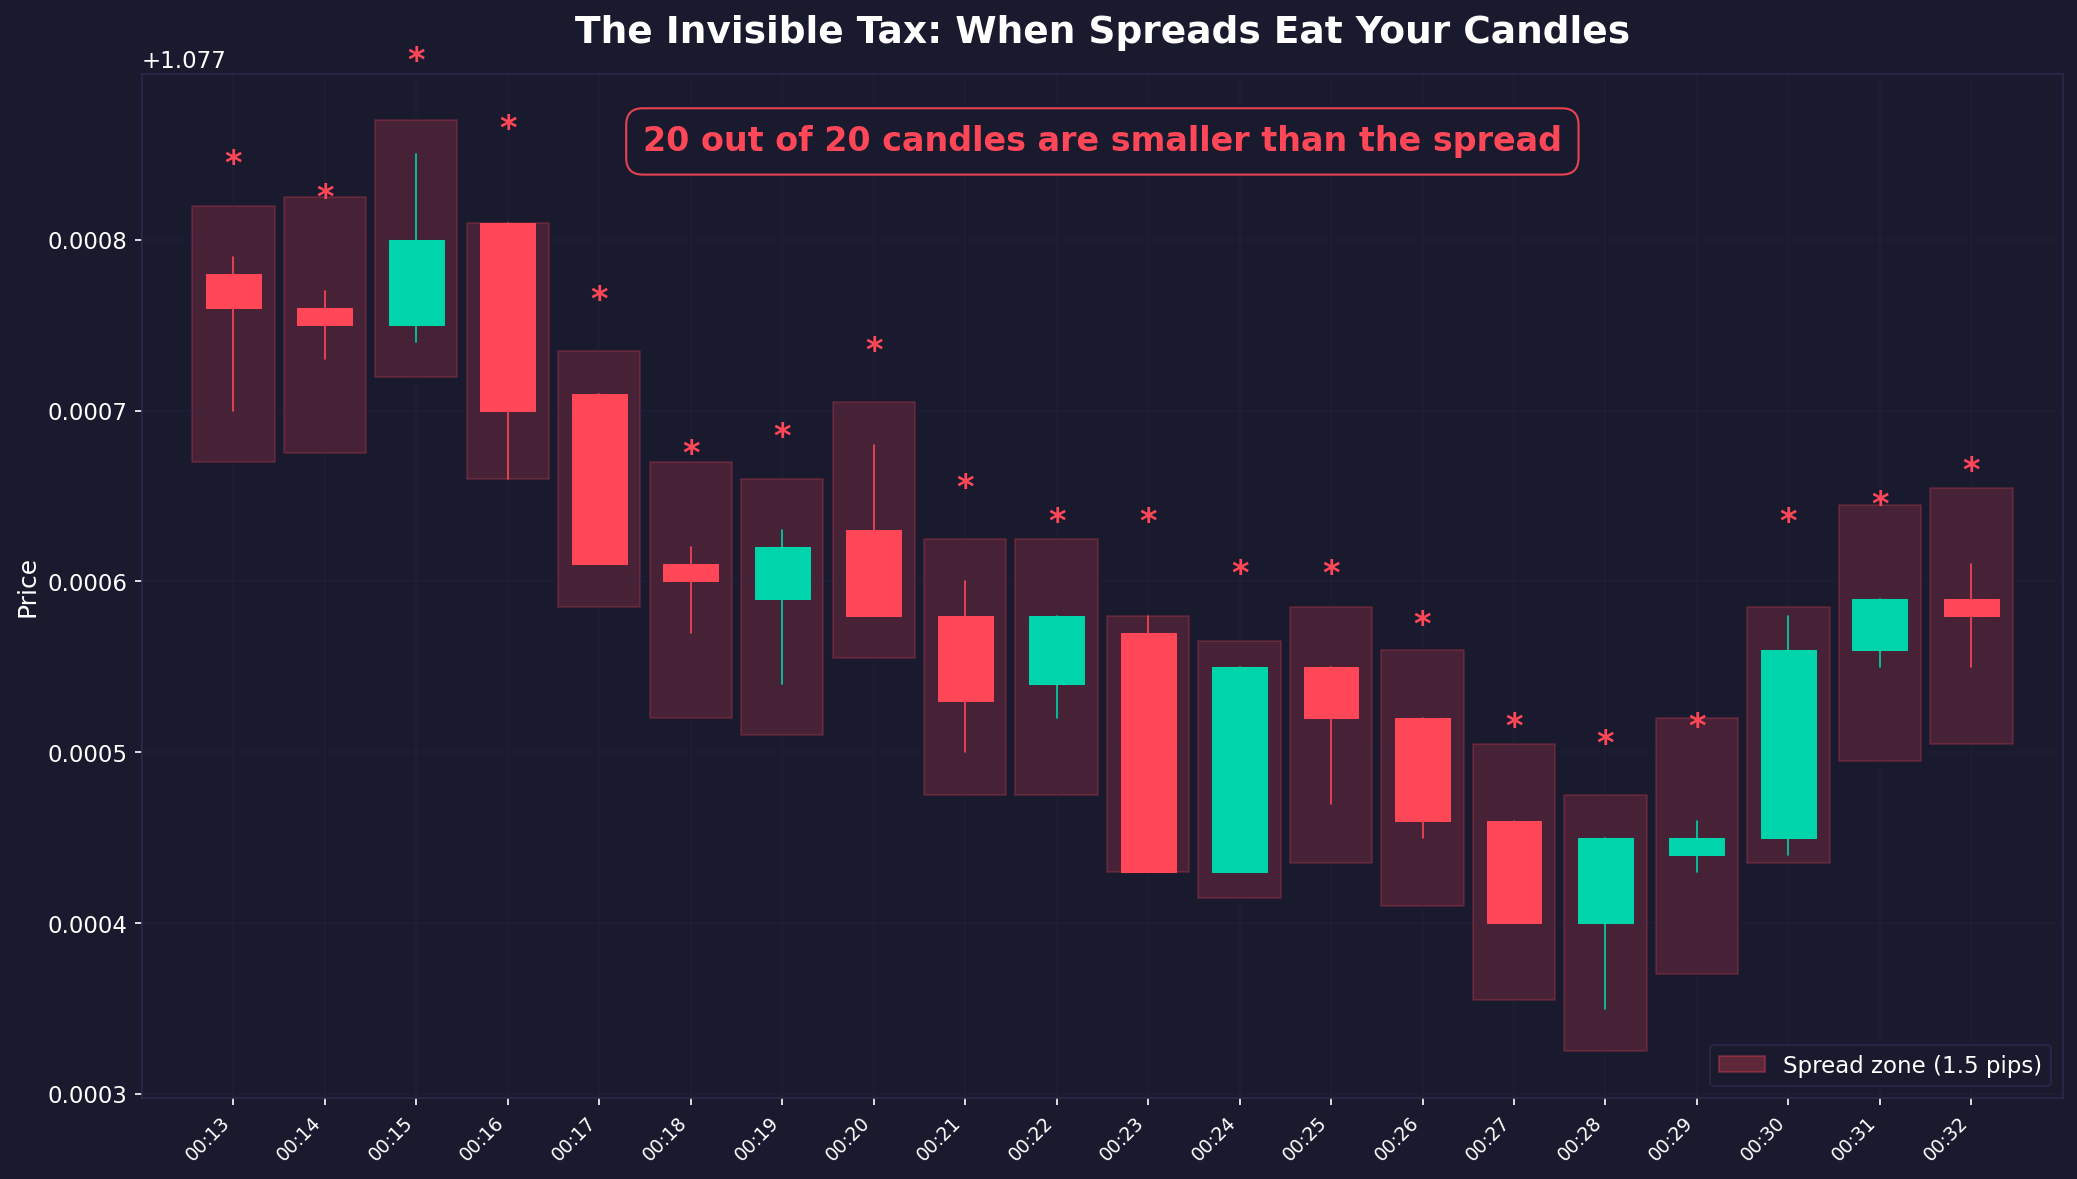
You're paying more to enter the trade than the market typically moves.
That's not a hard game. That's not even an unfair game. That's not a game at all. It's a donation box with a trading terminal painted on the front.
Think about it like this. You're at a carnival, and there's a game where you throw a ball at some bottles. The ball costs $1.40 to throw. If you knock down all the bottles, you win $1.30. Even if you're perfect — even if you knock down every bottle, every single time, with supernatural precision — you still lose a dime per throw. The game is structurally unwinnable. The only winning move is not to play.
That's 1-minute trading.
I sat there in my chair, looking at the wreckage of twenty strategies across five instruments, and I had one of those moments of clarity that only comes when you're tired enough to stop lying to yourself.
I watched my perfect bot — the one that never sleeps, never panics, never revenge-trades after a loss, never moves a stop-loss because it "feels" like the market is about to turn, never does any of the stupid human things that trading psychology books warn you about — lose everything. On every strategy. On every instrument.
It wasn't psychology. It wasn't emotion. It wasn't "discipline." It was math.
The bot didn't lose because it was imperfect. It lost because the game was impossible.
And that raised a question I wasn't ready to answer yet, but it planted itself in my brain like a splinter: if the game is impossible on 1-minute charts, at what point does it become possible?
I saved the results. Stared at the ceiling for a while. Then I started running the 5-minute tests, because who needs sleep when you've just discovered that an entire category of trading is mathematically impossible?
If 1-minute was the graveyard, maybe 5-minute was the hospital. Maybe things were injured but alive.
Three hours of sleep. Two espressos. One lingering hope.
Maybe — maybe — 1-minute was just too fast. Too noisy. Too dominated by the spread. Every trading forum has someone saying "1-minute is for robots and institutions, real scalpers use 5-minute." Five minutes is supposed to be the sweet spot. Fast enough to catch moves, slow enough to be tradeable. That's the theory, anyway. The beautiful, comforting, completely wrong theory.
I ran the first batch. Seventy-five strategy combinations using standard indicators — Moving Averages, RSI, MACD, Bollinger Bands, Stochastic, the greatest hits album of technical analysis. Every combination I could think of. Different periods, different settings, different entry and exit rules.
Seventy-five strategies. Zero profitable. Not "a few were marginal." Zero.
I thought maybe I was using the wrong indicators. Maybe the "standard" ones were too common, too crowded, too picked-over by the masses. So I went exotic. Ichimoku Cloud (all five lines, every combination). Keltner Channels. Chaikin Money Flow. Vortex Indicator. Donchian Channels. Stuff that most retail traders have never heard of, let alone coded into a bot.
Seventy-five more strategies. Seventy-five more failures. All hit -100%. Every single one.
The exotic indicators didn't perform differently from the standard ones. They performed identically. They all lost everything, at roughly the same rate, in roughly the same way. Different math, same grave. I started to feel something I hadn't felt since the beginning of this project. Not frustration — I'd burned through frustration somewhere around 3 AM the previous night. This was something colder. More clinical. The dawning recognition that I might not be looking at a problem with my strategies. I might be looking at a problem with the premise.
But I wasn't ready to accept that yet. I had more cards to play.
Price action. The purist's approach. No indicators at all. Just raw price — support and resistance levels, candlestick patterns, breakout structures, swing highs and lows. The stuff that people on trading Twitter call "the only thing that works" while posting screenshots of demo accounts.
Seventy-five combinations. Engulfing patterns with support/resistance. Pin bars at key levels. Inside bar breakouts. Two showed a positive return. My heart did the same stupid thing it did with the GBPUSD 1-minute results — it sped up. For about ten seconds, I thought I'd found something.
Then I checked the trade counts. Fewer than 7 trades each. Both of them. The same statistical ghost. The same nothing masquerading as something.
Statistical patterns on 5-minute: one barely positive. A z-score strategy on EURUSD returned +21% — with an 83% drawdown. An 83% drawdown means watching $10,000 drop to $1,700 before recovering. No sane risk manager would allow it. It's not an edge. It's a time bomb.
Smart money concepts on 5-minute: two marginally positive results, both with sample sizes too small to trust. Twenty-nine trades and eleven trades. You need hundreds — preferably thousands — for real statistical confidence.
Here's the thing about smart money concepts the YouTube gurus don't mention: the concepts themselves aren't wrong. Order blocks are real. Fair value gaps do tend to get filled. But the application on 5-minute charts is impossible for the same reason everything else is impossible: the spread eats the edge. It's like having a metal detector that can find gold nuggets, but you have to pay $50 per square foot to search. The detector works. The economics don't.
Total strategies tested on 1-minute and 5-minute charts: approximately 400. Zero viable winners.
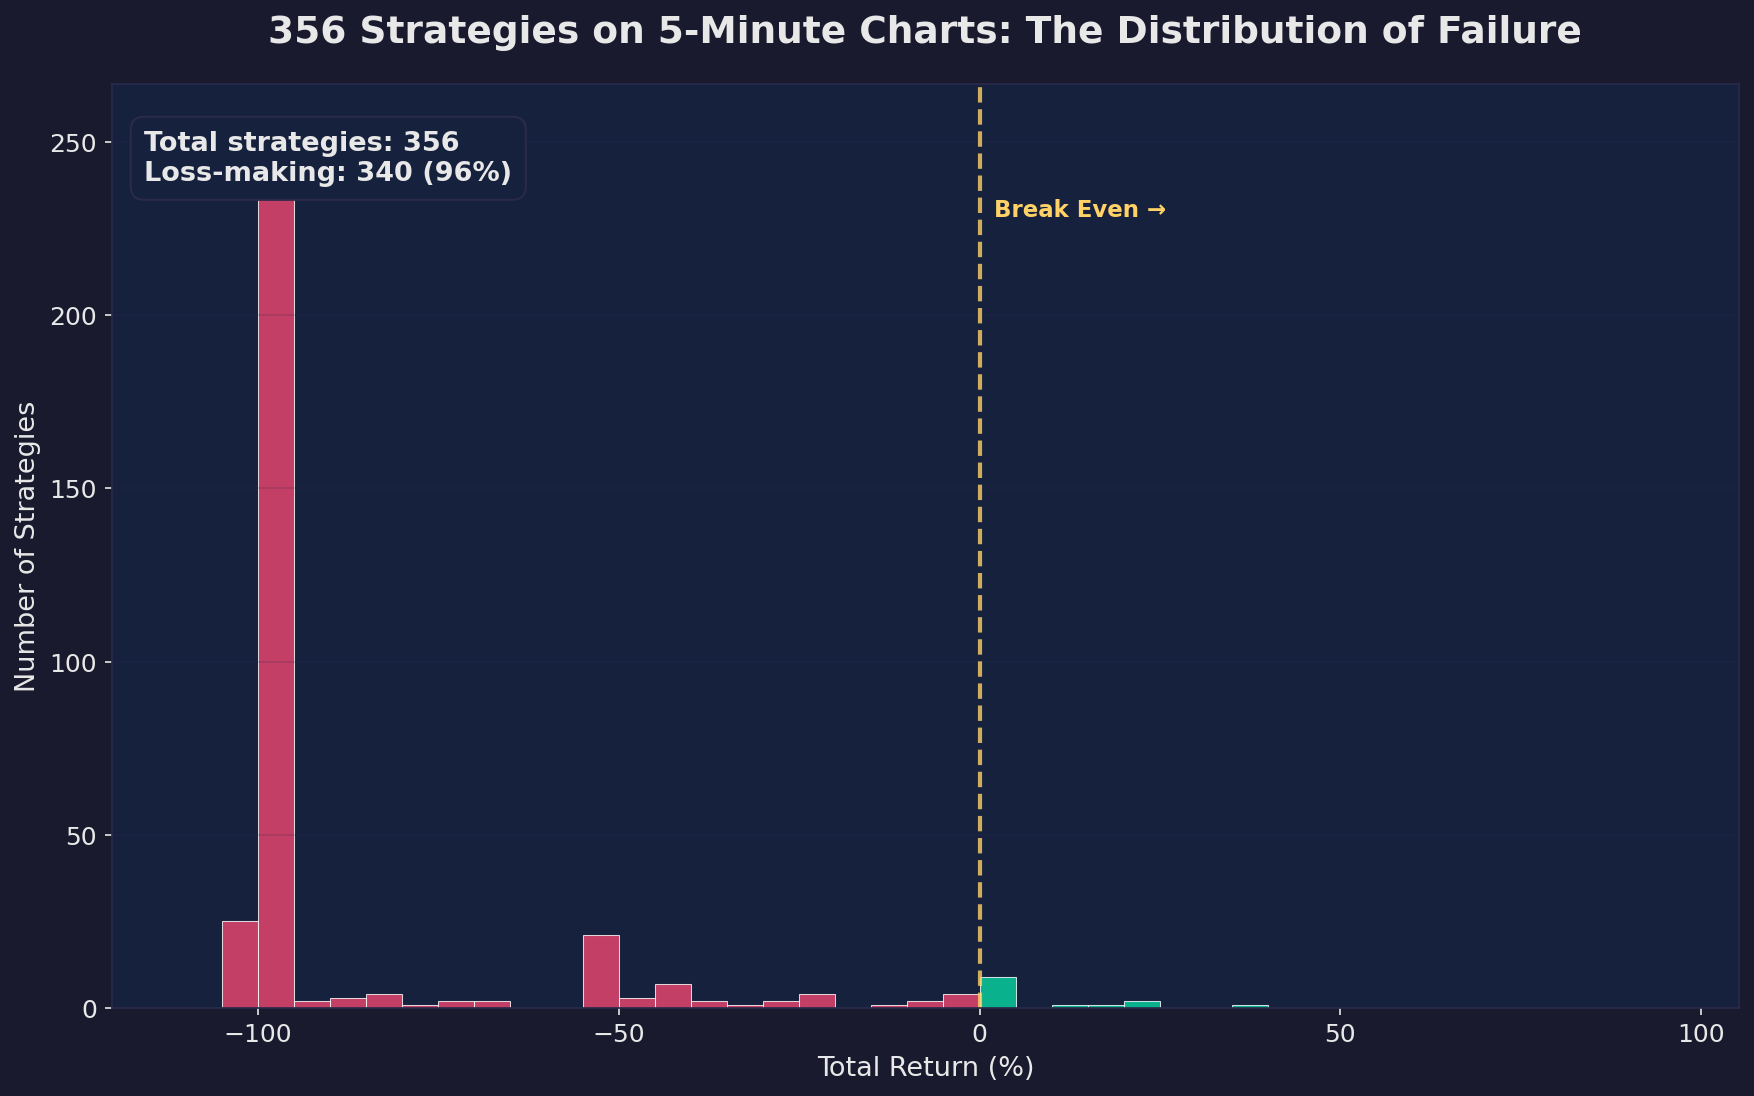
Every indicator known to mankind. Every smart money concept the YouTube gurus swear by. Zero winners. Not one. Not a single, solitary, viable, tradeable, sleep-at-night, risk-your-money-on-it winner.
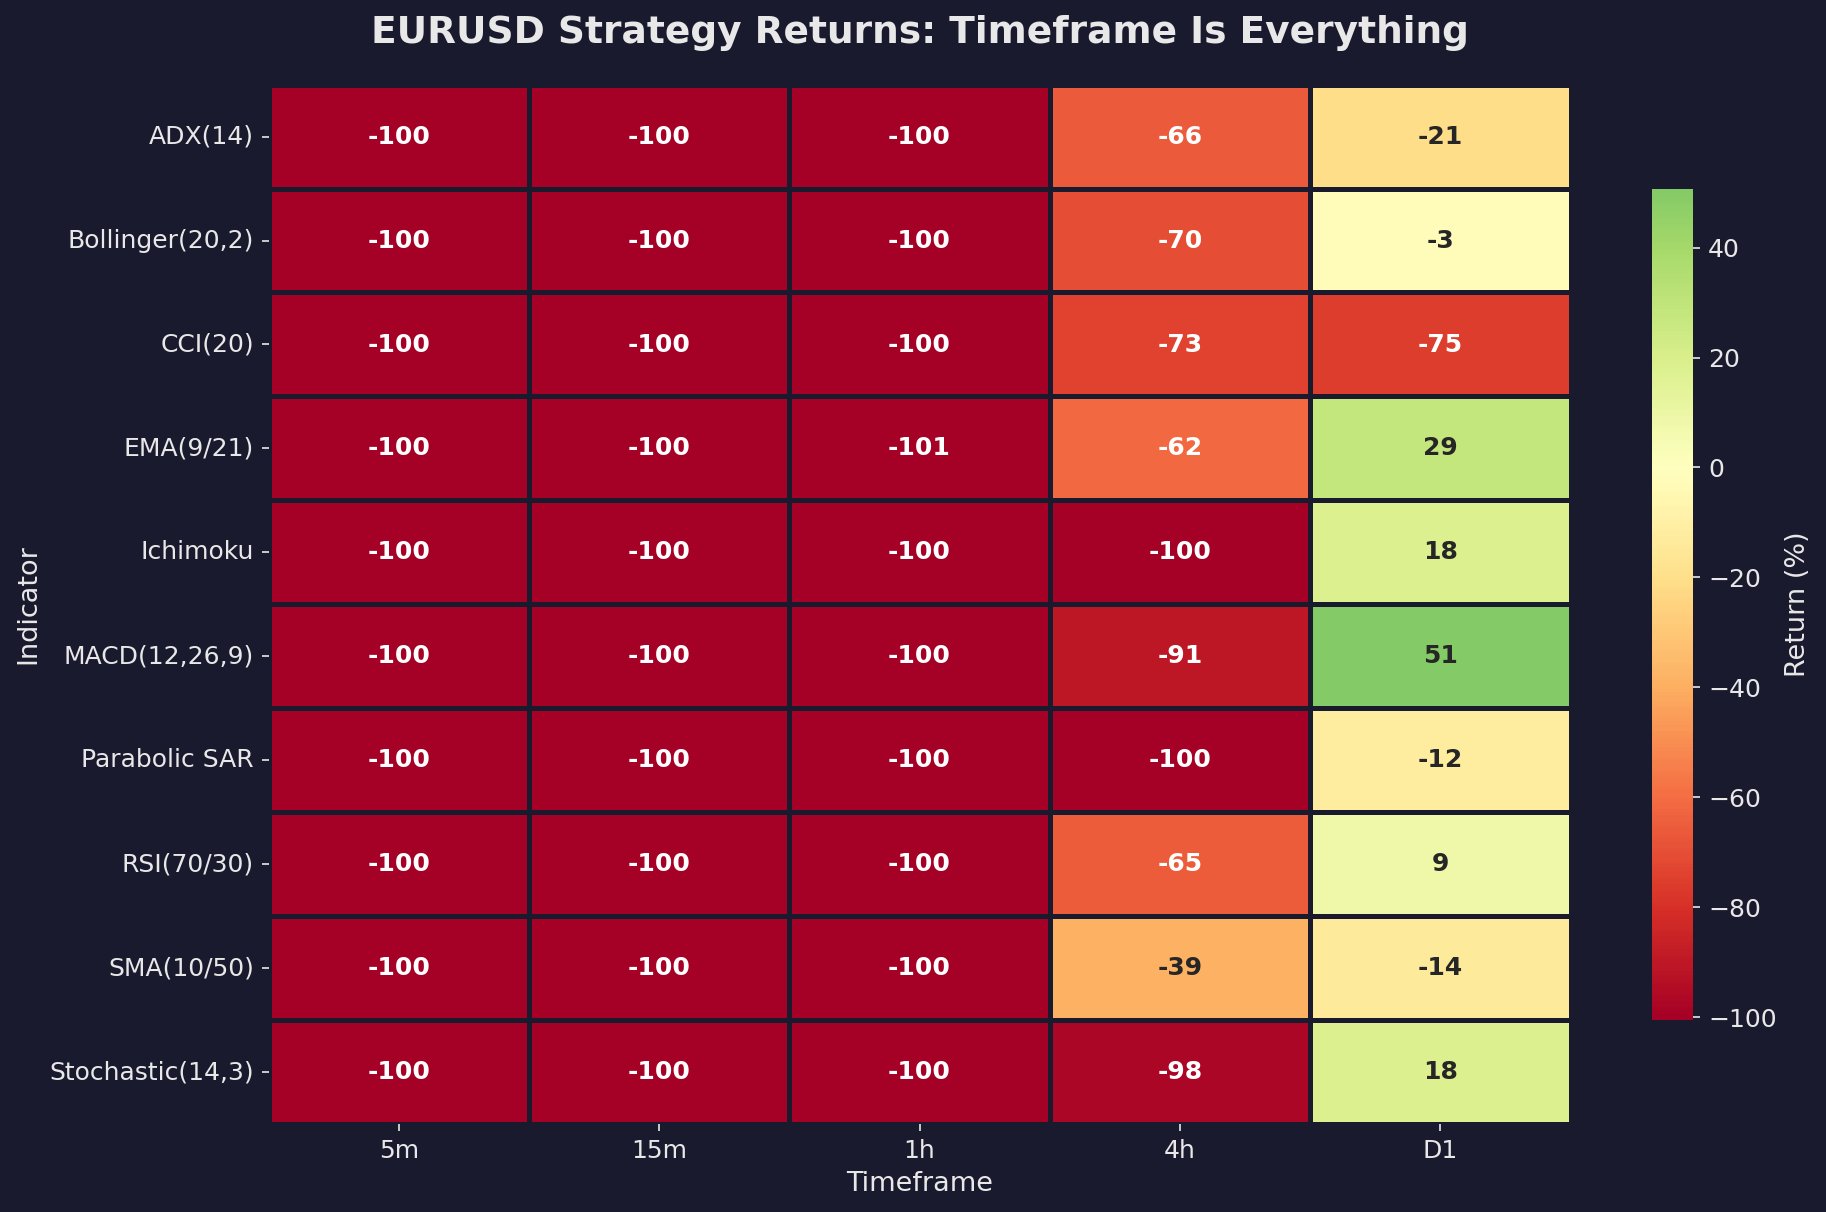
Fifteen-minute charts? Same story — nothing survived. One-hour? A few strategies limped along with profit factors barely above 1.0, but nothing you'd trust with real money. It wasn't until we reached the four-hour timeframe that the first signs of life appeared — but only for the most volatile instruments: Gold and USDJPY. Everything else needed daily charts.
This is where I need to talk about the Udemy courses.
I don't want to be mean. Some of these instructors probably believe what they're teaching. Belief is powerful. Belief can make you see patterns in randomness, edge in noise, signal in static. Belief is also the most expensive emotion in trading.
But here's what those courses are selling: "Learn to scalp EURUSD on 1-minute charts using a 20-period EMA and RSI! Make 10R per week!"
Ten R per week. For non-traders, "R" is your risk unit. If you risk $100 per trade, 10R is $1,000 per week. They're promising you'll make ten times your risk, every week, using a single moving average on 1-minute charts.
These courses cost between $50 and $200.
Our research — 600 strategies, 10 million candles, weeks of intensive development and testing — proves that these strategies are not just unlikely to work. They are mathematically impossible to profit from. The spread exceeds the ATR. The cost exceeds the opportunity. The game is rigged at the structural level.
They're selling you a map to a gold mine that is underwater. The map might be perfectly accurate. The gold mine might really be there. But you can't mine gold underwater with a pickaxe, and you can't scalp 1-minute EURUSD with a 1.4-pip spread when the average candle is 1.3 pips.
The worst part? The people who buy these courses and lose money blame themselves. They think, "I must not be disciplined enough. I must not be following the rules exactly. I need to work on my psychology." And then they buy another course. On "trading psychology." For another $100.
They're not undisciplined. They're not psychologically flawed. They're playing a game that cannot be won at the price they're paying to play it.
It's like selling someone a $50 book called "How to Jump Over Buildings" and when they can't do it, selling them a $100 follow-up called "The Psychology of Jumping." The problem was never their mindset. The problem was gravity.
And in trading, gravity is the spread.
That night — or morning, I'd stopped tracking which one it was — I sat in front of my screens with 400 failed strategies behind me and a question that was getting harder to ignore:
If it doesn't work on 1-minute, and it doesn't work on 5-minute, does it work on any timeframe?
Is there a point where the math flips? Where the spread stops being a death sentence and starts being just... a cost? A manageable, survivable, beatable cost?
I thought about quitting. Not in a dramatic way. In the quiet way. The way where you close your laptop and don't open it the next day. And then you don't open it the day after that.
I didn't quit. Not because I'm brave or dedicated. I didn't quit because the data was telling me something, and I'm constitutionally incapable of ignoring data that's telling me something. Even when what it's telling me is uncomfortable.
The data was telling me there was a wall. And I needed to find it.
Chapter 5: The Wall
Here's a thing about walls: you usually don't see them until you walk into them face-first.
I'd been walking face-first into this particular wall for weeks. Hundreds of strategies. Tens of thousands of backtests. Two timeframes that turned out to be killing fields. But I hadn't seen the wall yet. I'd felt it — in the results, in the equity curves, in the relentless procession of strategies that all found the same creative way to lose everything. But I hadn't understood it.
Then I did the math. Not the backtest math. The napkin math. The kind of math that's so simple it's almost insulting, the kind that makes you wonder why nobody talks about it, the kind that should be on the first page of every trading book ever written but somehow never is.
I calculated the spread-to-ATR ratio for EURUSD across every timeframe.
And the wall appeared.
The spread on EURUSD with a retail broker like Oanda is approximately 1.4 pips. That number doesn't change based on what timeframe you're looking at. Whether you're trading a 1-minute chart or a daily chart, you pay the same 1.4 pips to enter each trade. The spread is the toll. And the toll is the toll is the toll.
What does change is the ATR — how much the price typically moves in one candle. On a 1-minute chart, the price moves a little. On a daily chart, the price moves a lot.
Here's the table that changed everything:
1-minute EURUSD:
- Spread: 1.4 pips
- Average candle range (ATR): 1.3 pips
- Spread-to-ATR ratio: 108%
5-minute EURUSD:
- Spread: 1.4 pips
- Average candle range (ATR): 3.8 pips
- Spread-to-ATR ratio: 37%
1-hour EURUSD:
- Spread: 1.4 pips
- Average candle range (ATR): ~15 pips
- Spread-to-ATR ratio: 9%
Daily EURUSD:
- Spread: 1.4 pips
- Average candle range (ATR): ~80 pips
- Spread-to-ATR ratio: 1.7%
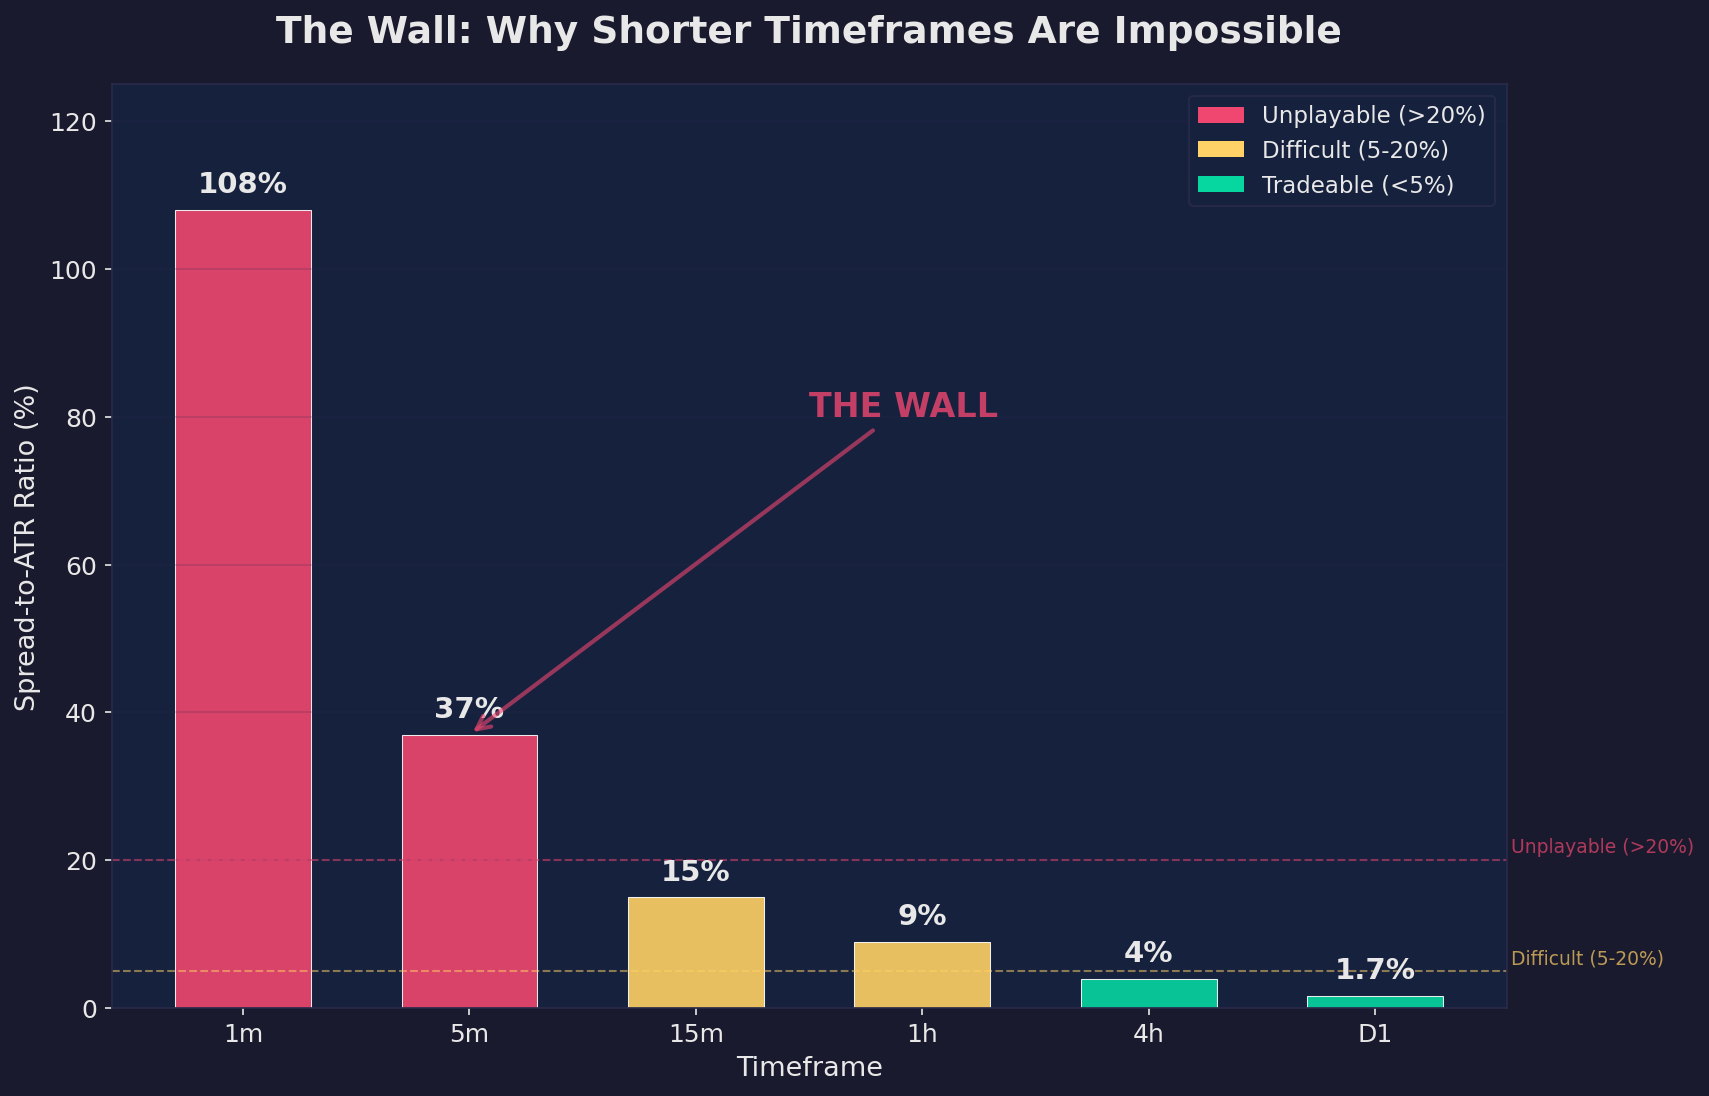
Read that column of percentages from top to bottom. 108%. 37%. 9%. 1.7%.
On 1-minute charts, you pay more than the market moves. On 5-minute charts, you lose more than a third of every move to the spread before your strategy even has a chance to express its edge. On 1-hour charts, you lose about a tenth. On daily charts, the spread is almost a rounding error.
That's the wall. Right there. In four numbers.
It's not a wall you can climb with a better strategy. It's not a wall you can tunnel under with a smarter indicator. It's not a wall you can go around with superior psychology or discipline or a morning meditation routine.
The wall IS the cost. It's structural. It's mathematical. And it's designed this way.
Let me make this visceral because numbers alone don't always land.
Imagine running a 100-meter race. But you don't start at the starting line. On 1-minute charts, you start 108 meters behind the starting line. You literally cannot reach the finish line. The race is over before it begins.
On 5-minute charts, you start 37 meters behind everyone else. You could be Usain Bolt and you'd still lose to a reasonably fit accountant who started at the actual starting line.
On 1-hour charts, you start 9 meters back. Now we're talking about a real handicap, but one that an exceptional athlete could potentially overcome.
On daily charts, you start 1.7 meters back. Still behind, but now talent matters more than the handicap. A great strategy can absorb a 1.7% cost.
That's the wall. It's not binary — "you can trade" or "you can't trade." It's a gradient. And somewhere on that slope, the handicap transitions from "physically impossible" to "difficult but potentially achievable."
But I didn't just want the theory. I wanted proof. I wanted to take the same strategy, on the same instrument, and test it across timeframes. If the spread-to-ATR ratio was really the wall, then a strategy that dies on 5-minute should come alive on daily.
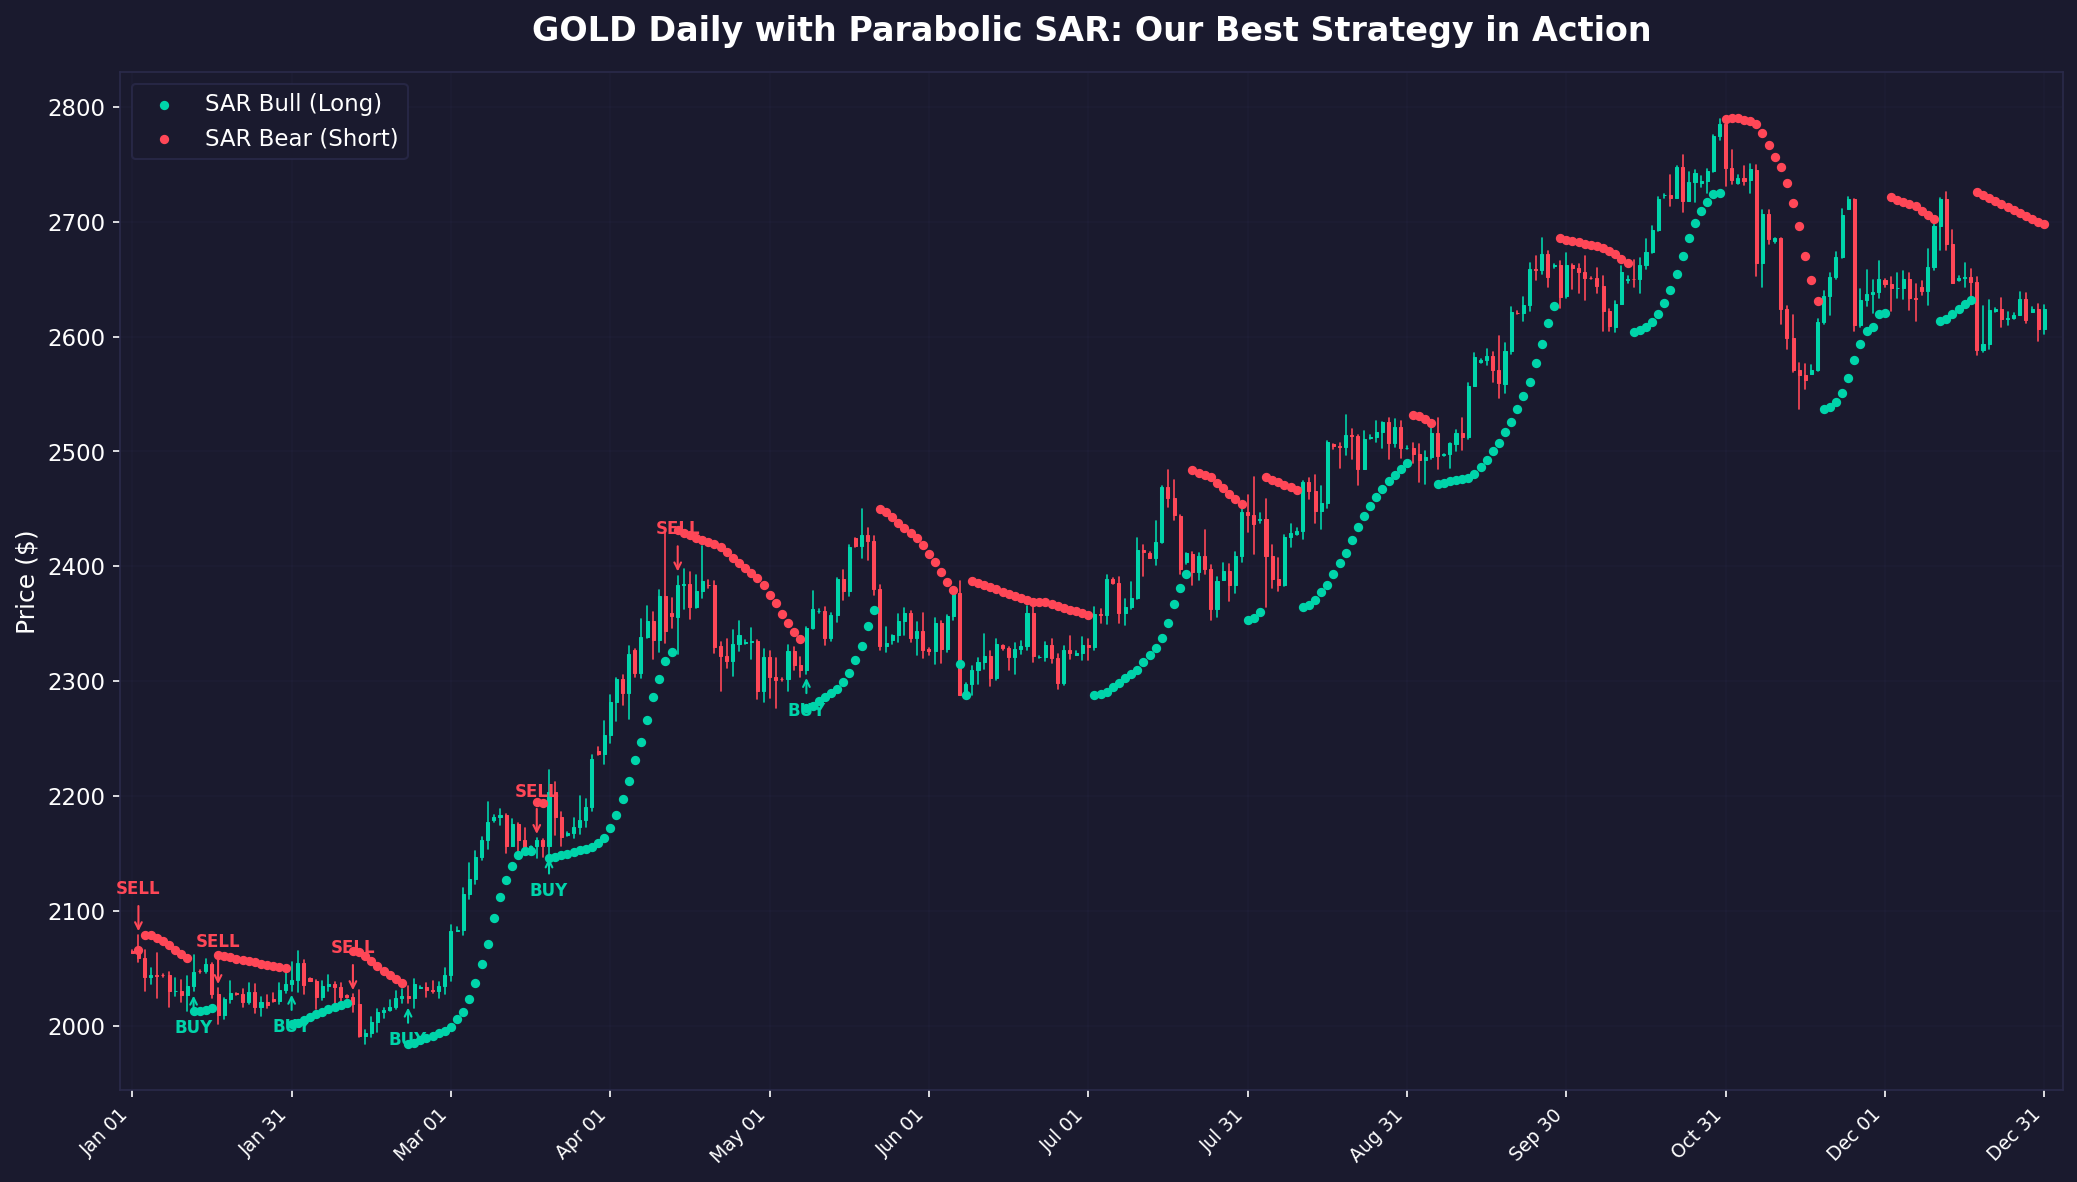
So I took Parabolic SAR on Gold.
On 5-minute Gold, the Parabolic SAR strategy lost everything. The equity curve went down and to the right, which, for the non-traders, is the direction equity curves go when you're about to need a second job.
On daily Gold, the same Parabolic SAR strategy — same parameters, same entry logic, same exit logic, same everything — returned +620%.
Six hundred and twenty percent.
Same indicator. Same math. Same market. Same gold, same atoms of gold, same price of gold determined by the same global forces of supply and demand and central bank lunacy. The ONLY thing that changed was the timeframe. And by changing the timeframe, I changed the spread-to-ATR ratio. And by changing the spread-to-ATR ratio, I turned a guaranteed loser into a massive winner.
I stared at those two results side by side for a long time. The 5-minute chart: a flatline of death. The daily chart: a hockey stick of compound returns. Same strategy. Same market.
That's when I understood the wall. Not intellectually — I'd understood it intellectually when I calculated the ratios. I understood it viscerally. In my bones.
The wall isn't about strategy. The wall is about cost.
And this is where it gets really uncomfortable. Because the cost isn't the same for everyone.
Retail traders pay a spread of approximately 0.9 to 1.4 pips on EURUSD. Institutional traders — hedge funds, banks, proprietary trading firms — pay approximately 0.1 pips.
Zero point one pips.
That's nine to fourteen times more for retail. On 1-minute EURUSD, where retail traders face a spread-to-ATR ratio of 108%, institutions face about 8%. On 5-minute, where retail faces 37%, institutions face about 3%.
The game isn't just tilted. It's tilted differently depending on who you are. Same highway, different tolls. And the toll booth is owned by the same people who told you the highway was free.
The strategies aren't different. The firms don't have magical indicators or secret algorithms. The main advantage is simpler and more brutal than any algorithm: they pay less. They pay less to enter. They pay less to exit. And over hundreds or thousands of trades, that difference is the entire margin of the business.
Here's what I learned from the wall:
Lesson 1: The game changes at different timeframes. 1-minute trading and daily trading share a name — "trading" — but they share almost nothing else. The cost structure is different. The statistical properties are different. Calling them both "trading" is like calling both checkers and chess "board games." Technically true. Practically useless.
Lesson 2: Most retail trading education teaches the wrong game. Not because the instructors are evil. But because the game they're teaching — fast-timeframe scalping — is the game where retail traders have the biggest disadvantage. Why do they teach it? Because it's exciting. Because it generates lots of trades, lots of screenshots, lots of content. Showing someone a daily chart where you hold a trade for three weeks is boring. And boring doesn't sell courses.
Lesson 3: The question isn't "what strategy should I use?" The question is "at what cost am I trading?" I spent weeks building 600 strategies, and the single most important variable wasn't the indicator, the entry rule, the exit rule, the risk management, or the position sizing. It was the spread-to-ATR ratio. Everything else is secondary.
Lesson 4: The wall isn't a secret. It's just not profitable to talk about. Brokers make money from spreads. More trades means more spread revenue. Fast timeframes generate more trades. It's not a conspiracy. It's just business. The butcher doesn't tell you to go vegetarian.
I found the wall. I mapped it. I measured it. I understood it.
And now I had a choice. I could accept the wall as the end of the story — "trading is rigged, retail can't win, go get a real job" — or I could accept the wall as information and ask the next logical question.
If the spread-to-ATR ratio improves as the timeframe increases, is there a timeframe where retail traders can actually compete?
The data from Parabolic SAR on Gold suggested yes. +620% on daily is not a fluke. It's too many trades, too consistent, too clean to be noise.
But one strategy on one instrument on one timeframe is an anecdote, not evidence. I needed more data. A lot more data.
So I did what I'd been doing since the beginning. I went back to the lab. I opened my code editor. I queued up the next batch of tests.
But this time, I wasn't starting from zero. I had the wall. I had the map. I knew where not to dig. And I knew, for the first time since I started this project, that there might be something worth finding on the other side.
Not a guarantee. Not a promise. Not a Udemy course with a money-back guarantee and a stock photo of a Lamborghini.
Just a possibility. A mathematical, structural, data-supported possibility.
And honestly? After weeks in the graveyard, a possibility felt like a miracle.
Chapter 6: The Survivors
Out of 600 strategies, five survived.
Let me say that again, because I need you to feel the weight of it. I tested over 600 combinations of indicators, timeframes, instruments, and exit methods. I ran them across five years of tick data. I validated them with walk-forward analysis. I stress-tested them with Monte Carlo simulations. I did everything short of sacrificing a goat to the trading gods.
Five survived.
And they were all boring.
I remember the exact moment I realized what the winners had in common. I was staring at my spreadsheet — this monstrous, color-coded beast that had consumed weeks of my life — and I sorted by profitability. The top five strategies all shared the same cell in the "Timeframe" column.
Daily.
Every single one. Not the 1-minute charts I started with. Not the 15-minute charts that felt like a reasonable compromise. Not even the 4-hour charts that seemed sophisticated enough to work. Daily. The timeframe that requires you to check your screen once per day, make a decision, and then go live your life.
The timeframe that no one on YouTube talks about because it is physically impossible to make a dramatic face while describing it.
Let me introduce you to the five strategies that didn't die.
Strategy #1: GOLD Parabolic SAR D1 with Trailing Stop
Return: +620.49%
Maximum Drawdown: 5.17%
Profit Factor: 3.88
Total Trades: 155
Win Rate: 62.58%
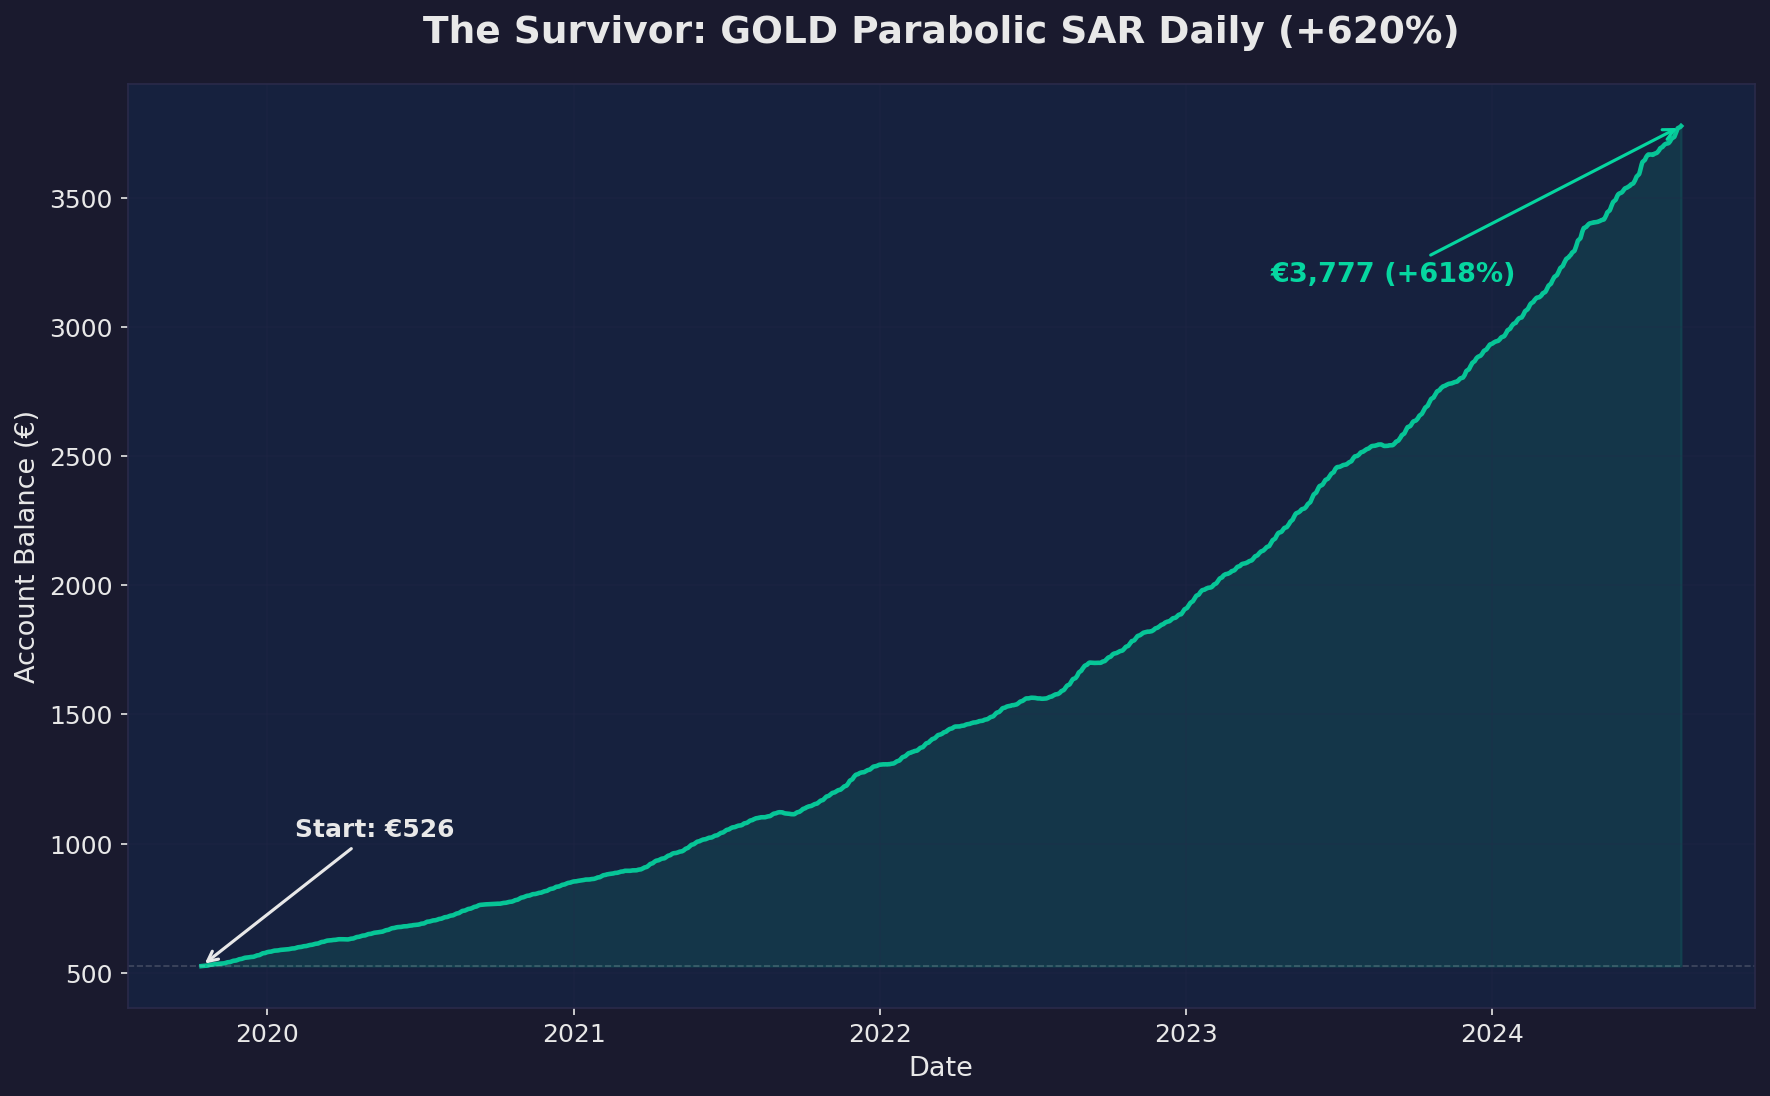
This is the crown jewel. The strategy that made me question everything I thought I knew about trading. And it is absurdly simple.
The Parabolic SAR — Stop and Reverse — is an indicator from the 1970s. Welles Wilder invented it. It puts dots above or below the price to show trend direction. When the dots flip from above to below, you go long. When they flip from below to above, you go short. A child could code it. I am not being hyperbolic; my niece probably could, and she is eleven.
Applied to Gold on the daily chart with a trailing stop exit, this dinosaur of an indicator produced a 620% return over five years with a maximum drawdown of just 5.17%.
Let me put that drawdown number in context. Most hedge funds consider a 20% drawdown "within normal parameters." The S&P 500 dropped 34% in March 2020. My boring, geriatric indicator on the world's most boring timeframe had a max drawdown of 5.17%.
The profit factor of 3.88 means that for every dollar this strategy lost, it made $3.88. Across 155 trades. That is roughly one trade every 6-7 trading days. About three trades per month.
Try making a TikTok about that. "Hey guys, just placed my third trade this month! Now I am going to go read a book and not look at my phone until tomorrow morning!" Zero likes. Zero follows. Zero dopamine hits. Maximum profit.
Strategy #2: GOLD Keltner Channel D1 with Trailing Stop
Return: +341.06%
Maximum Drawdown: 10.61%
Profit Factor: 2.58
Total Trades: 145
The Keltner Channel is essentially Bollinger Bands' less famous cousin. It wraps a moving average with bands based on the Average True Range. When price breaks above the upper band, you buy. When it breaks below the lower band, you sell.
Again, Gold. Again, daily chart. Again, trailing stop. Again, boring as hell. Again, it worked.
341% over five years. The drawdown is higher than the PSAR strategy at 10.61%, which means there were periods where you would be sitting at your desk watching 10% of your account evaporate and wondering if the whole thing was broken. But 145 trades with a profit factor of 2.58 is the kind of result that institutional traders would frame and hang on their wall.
You know what institutional traders would not do? Share it on a Telegram group for $49.99 per month.
Strategy #3: GBPUSD EMA 20/50 D1 with Opposite Signal Exit
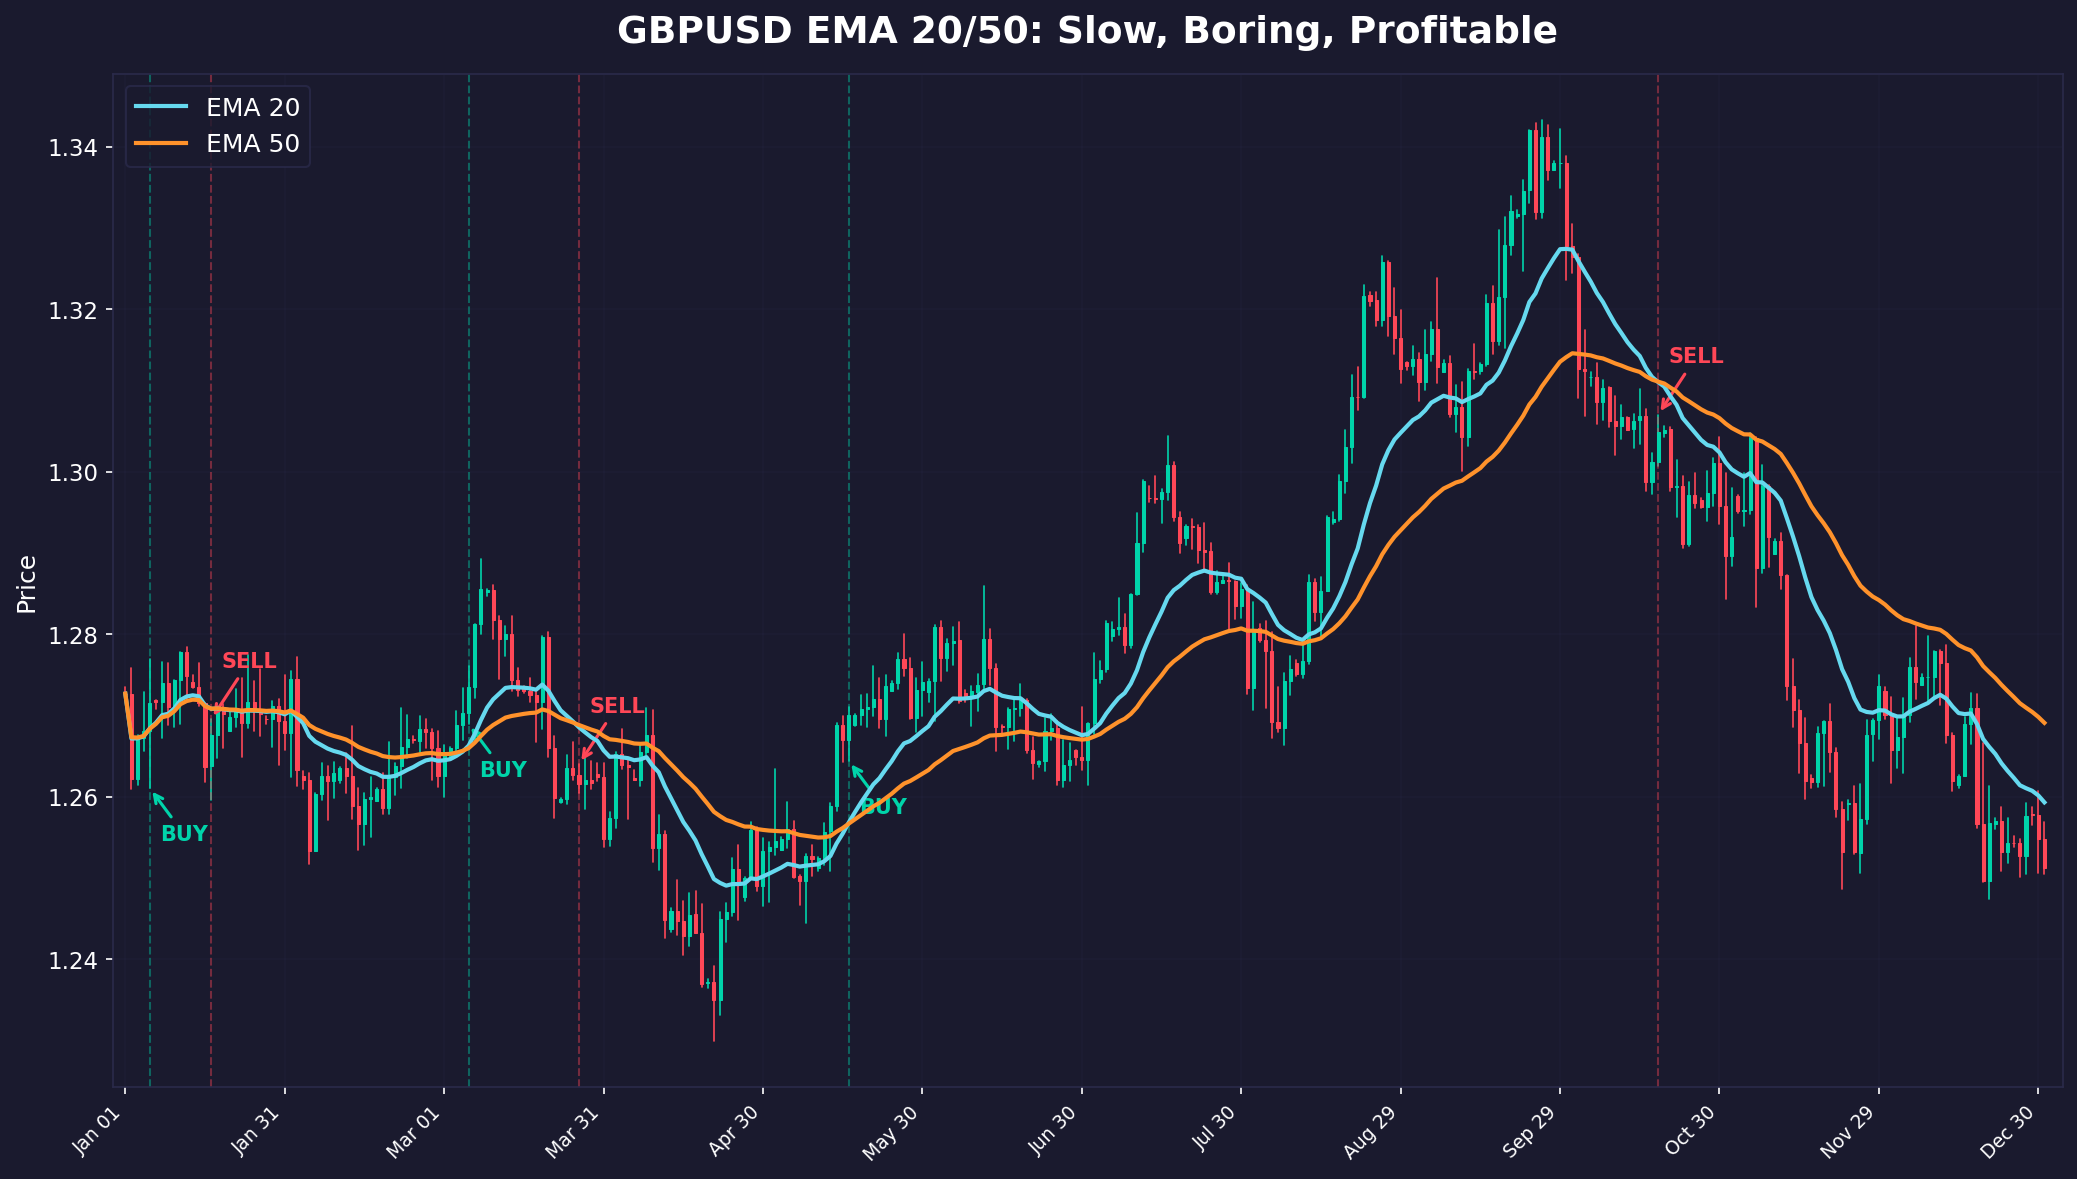
Return: +256.25%
Maximum Drawdown: 29.28%
Profit Factor: 2.04
Total Trades: 31
Win Rate: 51.61%
This one is different. Not Gold. Not a volatility indicator. Just two Exponential Moving Averages — a fast one (20-period) and a slow one (50-period) — applied to the British Pound against the US Dollar.
When the fast EMA crosses above the slow EMA, you go long. When it crosses below, you go short. The exit is not a trailing stop — it is the opposite signal. You stay in the trade until the moving averages cross the other way.
Thirty-one trades in five years. That is roughly one trade every two months. The win rate is barely above a coin flip at 51.61%. But the profit factor of 2.04 tells you the winners were significantly larger than the losers. This strategy wins by catching big trends and riding them until they reverse, not by being right more often than it is wrong.
The drawdown of 29.28% is the highest among our survivors, which makes psychological sense — when you are only taking six trades per year and one goes against you for weeks, your brain starts composing resignation letters to the market. But over five years, those 31 trades turned into a 256% return.
Thirty-one trades. I have seen day traders take 31 trades before lunch.
Strategy #4: DE30 Morning/Evening Star D1
Return: +127.5%
Maximum Drawdown: 21.6%
Profit Factor: 1.83
Walk-Forward Validation: 6/6 periods positive — ROBUST
Now we are getting into the more modest returns, and that is perfectly fine because this strategy has something the others need to be jealous of: a perfect walk-forward validation score. Six out of six test periods were profitable. Not five out of six. Not "mostly positive." Six for six. Every single out-of-sample period made money.
The Morning Star and Evening Star are candlestick patterns. They have been around since Japanese rice traders were using them in the 1700s. A Morning Star is a three-candle bullish reversal pattern. An Evening Star is its bearish mirror. Applied to the German DAX index on the daily chart, these patterns from three centuries ago still work.
127.5% over five years will not make anyone's jaw drop. That is roughly 18% per year, which is excellent by any rational standard but will not get you invited to speak at a crypto conference. The profit factor of 1.83 is the lowest among our survivors, meaning the edge is thinner. But it is there. And it survived every single validation period we threw at it.
There is something philosophically satisfying about a pattern from the Edo period outperforming a machine learning algorithm on 1-minute charts. The market has not changed as much as the trading industry wants you to believe.
Strategy #5: EURUSD TRIX D1
Return: +114.2%
Maximum Drawdown: 28.9%
Profit Factor: 1.41
Walk-Forward Validation: 5/6 periods positive — ROBUST
The TRIX indicator is a triple-smoothed exponential moving average shown as a percentage. If that sentence made your eyes glaze over, perfect — you are having the correct reaction. It is a trend-following indicator that filters out noise by smoothing the data three times. It is the trading equivalent of asking someone to repeat themselves three times before you believe them.
Applied to the Euro-Dollar pair on the daily chart, TRIX produced 114.2% over five years. Not spectacular. But robust — five out of six walk-forward periods were positive, meaning this was not a fluke.
The drawdown of 28.9% is substantial. There would have been months where this strategy was deep in the red, and every fiber of your being would scream to turn it off. The people who would have succeeded with this strategy are the people who set it up, verified it was running correctly once per day, and then went to do literally anything else with their lives.
What the Survivors Have in Common
I spent a long time staring at these five strategies, looking for the pattern. Here is what I found:
Daily timeframe. All five. No exceptions. The daily chart filters out the noise, the manipulation, the stop-hunting, the spread widening, the slippage, and all the other micro-level chaos that eats short-timeframe strategies alive.
Patience. The most active strategy (GOLD PSAR) trades about once every six or seven days. The least active (GBPUSD EMA) trades about once every two months. These strategies spend most of their time doing nothing. They wait. They wait some more. Then they act.
Simplicity. A Parabolic SAR. A Keltner Channel. Two moving averages. Candlestick patterns from the 1700s. A triple-smoothed average. None of these are exotic. None require a PhD to understand. None have 15 parameters to optimize. They are the kind of strategies that make quant traders sneer and retail gurus yawn.
Few trades per month. This is the opposite of what the trading industry sells. The industry sells action. Signals. Alerts. Excitement. The market's version of a slot machine, where every ping and notification is another pull of the lever. Our survivors are the anti-slot machine. They are the traders sitting in the corner, reading a newspaper, occasionally glancing at a chart, and quietly making money.
The Trailing Stop Discovery
I need to tell you about the single most important finding of the entire project, and it has nothing to do with entries.
The GOLD Parabolic SAR strategy, before I added the trailing stop, had these stats:
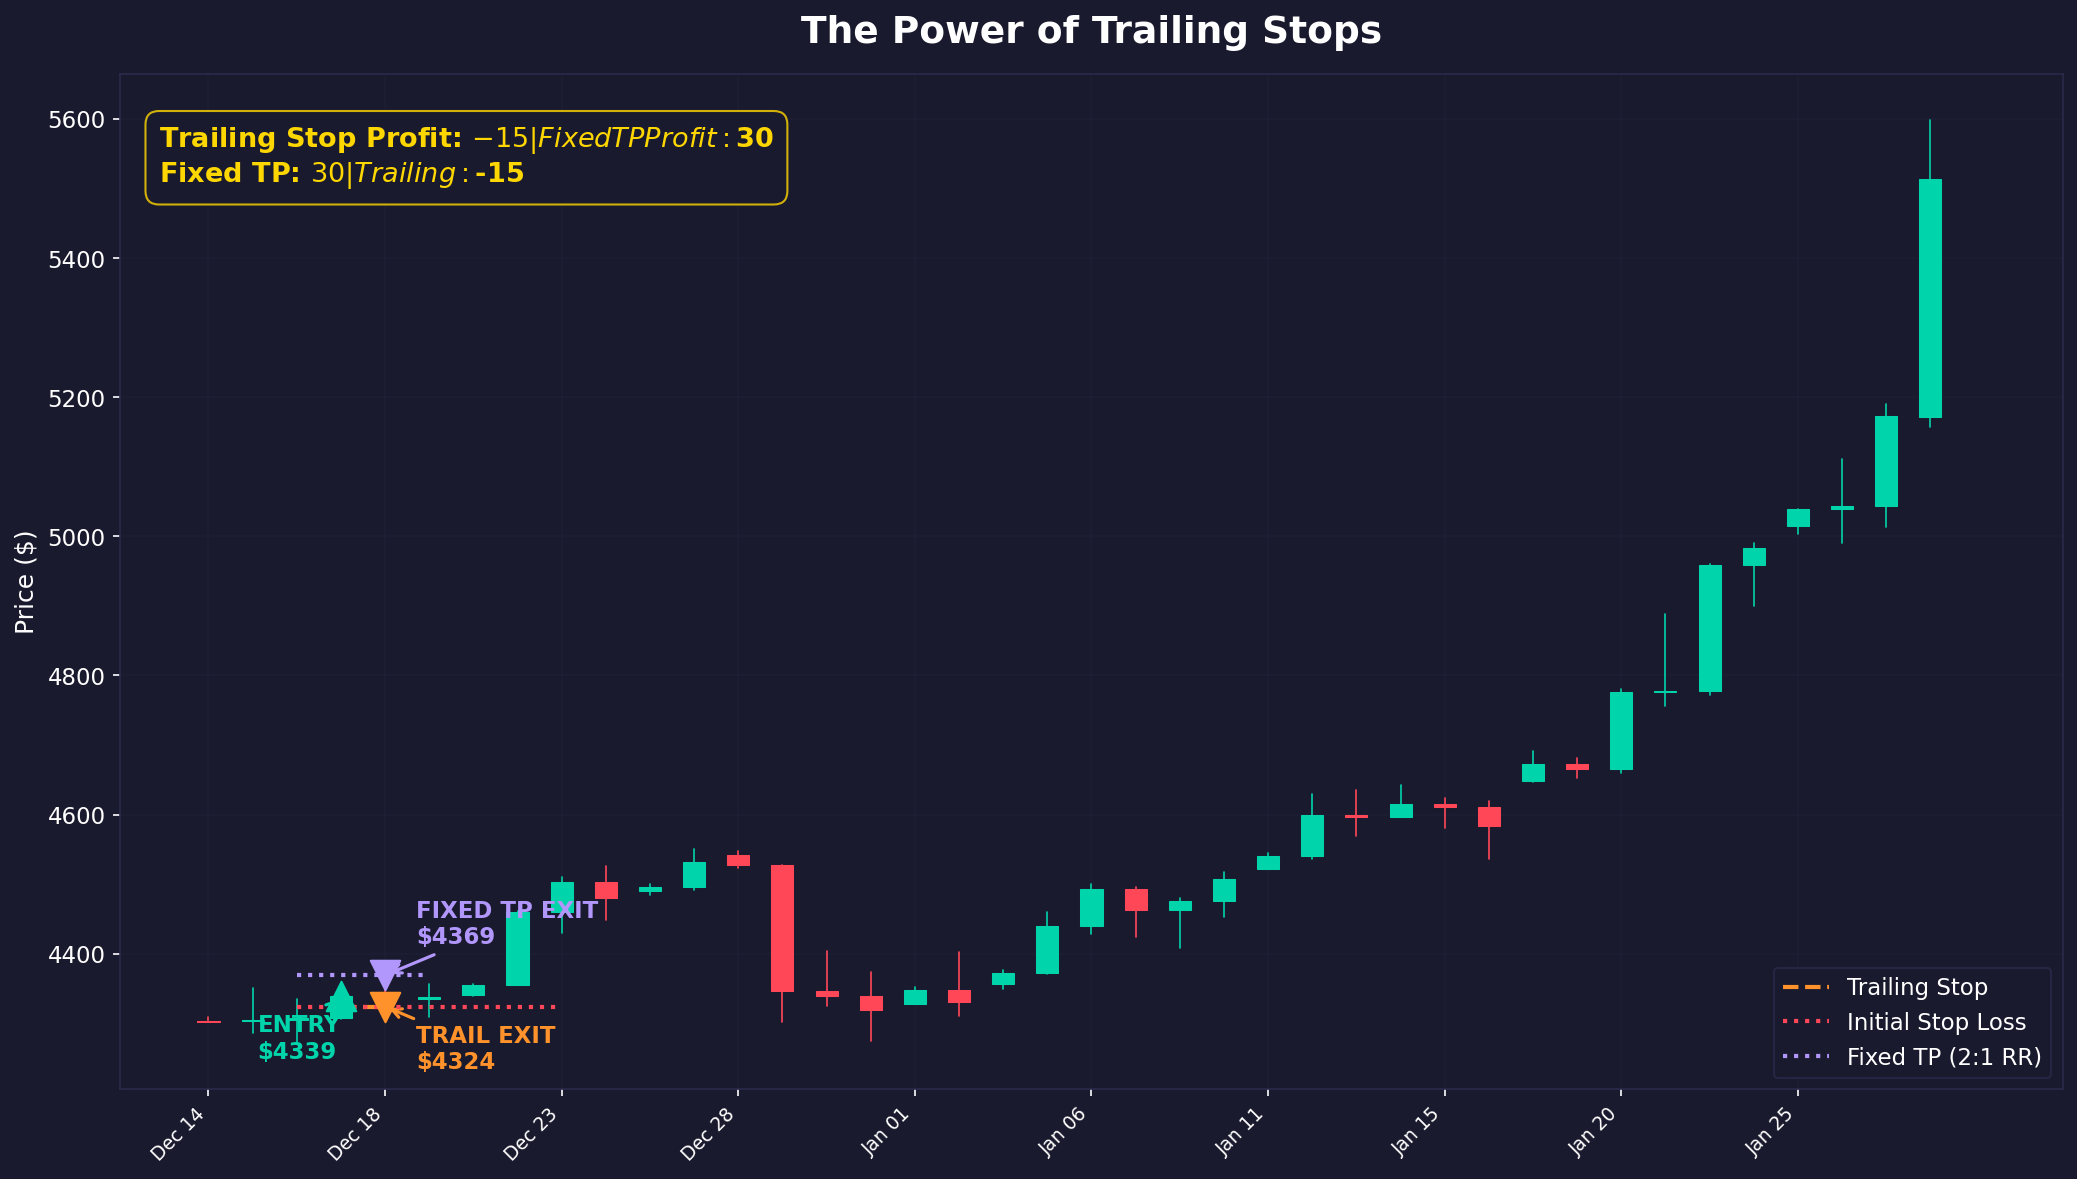
- Return: +150% (approximately)
- Maximum Drawdown: 33%
- Profit Factor: decent but unremarkable
Then I replaced the fixed take-profit with a trailing stop.
- Return: +620.49%
- Maximum Drawdown: 5.17%
- Profit Factor: 3.88
Read those numbers again. The return quadrupled. The drawdown dropped by 85%. The strategy went from "interesting" to "best thing I have ever tested." And I changed exactly one thing: how the strategy exits winning trades.
The fixed take-profit was cutting winning trades at a predetermined level. The trailing stop let winners run, locking in profit as the trade moved in our favor but never capping the upside. When Gold went on a multi-week trend, the fixed TP exited at +2% while the trailing stop rode it to +8%, +12%, sometimes +15%.
The entry was the same. The Parabolic SAR flip. The same signal, the same timing, the same everything — except what happened after you got in.
The exit strategy mattered more than the entry strategy.
I will say it louder for the people in the back who are still arguing about RSI vs. MACD on Twitter: the exit strategy mattered more than the entry strategy.
This finding haunted me. Because the entire retail trading education industry is obsessed with entries. When to get in. What signal to follow. Which indicator is "the best." Every YouTube thumbnail shows an entry arrow. Every course teaches entry techniques. Every Telegram group sends entry signals.
And the thing that actually mattered — what you do after you are in the trade — is barely discussed. It is the afterthought. The boring part. The part that turned a 150% strategy into a 620% strategy.
The Irony
The best trading strategy I found trades about once every 10 days. It requires checking your phone once per day. It is the least exciting thing I have ever built. Instagram would never feature it. No one would pay $99/month for a Telegram channel that sends three signals per month. It has zero content potential. Zero dopamine reward. Zero drama.
And it made +620% in five years.
Meanwhile, the strategies that would have made incredible content — the ones with dozens of trades per day, the flashy indicators, the dramatic entries on 1-minute charts — lost everything. Every single one. One hundred percent loss rate across hundreds of strategies on every timeframe below daily.
The market rewards the opposite of what social media rewards. Social media rewards frequency, excitement, action, and drama. The market rewards patience, boredom, inaction, and restraint. These two incentive structures are perfectly, almost poetically, misaligned.
And that misalignment is where the retail trading industry makes its money. Not from the market. From you. By selling you the excitement that the market punishes.
Five strategies survived. They are all boring. They all require patience. They all trade on the daily chart. And none of them would get a single like on Instagram.
I would not have it any other way.
Chapter 7: The Mirages
Let me tell you about the most dangerous number I encountered in this entire project.
+3,140%.
Three thousand, one hundred and forty percent. That was the backtested return of USDJPY MACD on the 4-hour chart. When I first saw it, I did what any reasonable person would do: I stared at it, refreshed the page, stared at it again, and then started mentally shopping for a boat.
Three thousand percent. In five years. On a relatively simple MACD crossover strategy. The numbers were right there in the backtest. Clear as day. Verified. Reproducible. Every trade logged, every entry and exit timestamped, every pip accounted for.
And it was complete garbage.
Not just "not as good as it looked" garbage. Not "slightly overstated" garbage. Total, absolute, would-have-lost-everything-if-I-traded-it garbage. The kind of garbage that is wrapped in such beautiful packaging that you would display it on your shelf and show it to your friends before realizing it was, in fact, garbage.
This chapter is about how I found out. And more importantly, how you can protect yourself from the same trap — because if you have ever seen a backtest result that made you excited, you have already stepped on the first landmine.
Walk-Forward Validation: The Bullshit Detector
Before I explain what walk-forward validation is, let me tell you what backtesting alone does.
Backtesting takes historical data and runs your strategy across it. "If I had used this strategy from 2019 to 2024, here is what would have happened." It is like watching a recording of a football match and claiming you predicted every goal. You know the outcome. The strategy knows the outcome. Everyone is a genius in hindsight.
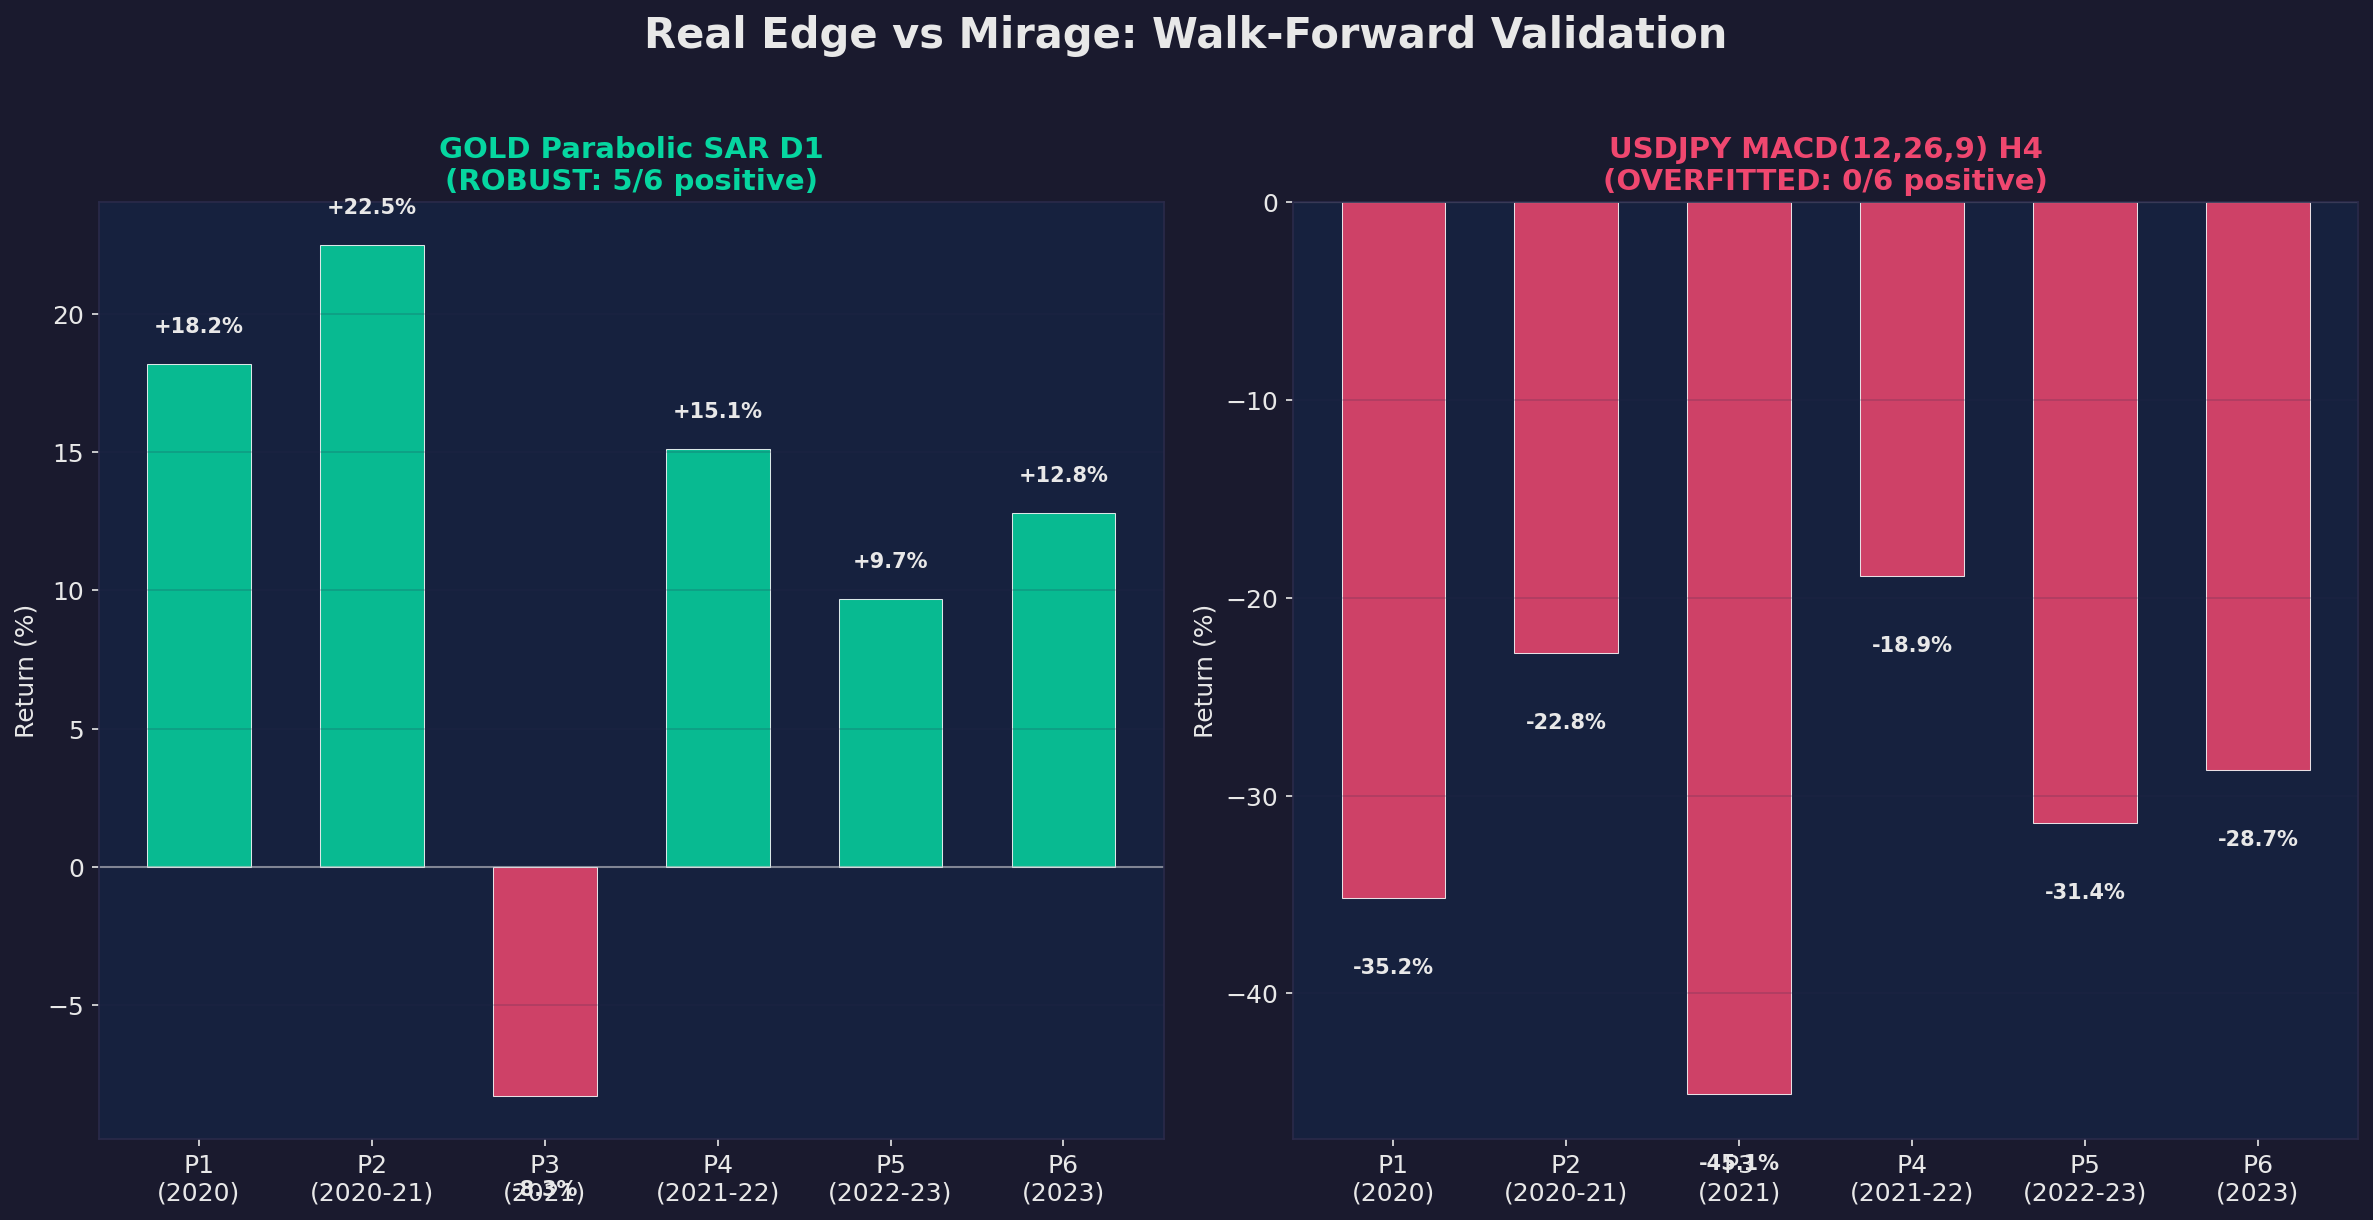
Walk-forward validation is different. It is the thing that separates people who think they have a working strategy from people who actually have one.
Here is how it works, in the simplest possible terms:
Take your five years of data. Split it into six periods. Use the first period to develop and optimize your strategy. Then — and this is the critical part — test it on the second period, which the strategy has never seen. It is out-of-sample data. Fresh. Unknown. The strategy's first encounter with reality.
Then slide the window forward. Optimize on periods one and two. Test on period three. Optimize on one through three. Test on four. And so on.
It is like studying for a test with the answer key, then taking a different test. If you still pass, you actually learned something. If you fail, you were just memorizing.
Six periods. Six fresh tests. If your strategy is genuinely capturing some real market dynamic — some actual pattern that exists in the world — it should be profitable in most or all of those out-of-sample periods. Not necessarily by the same amount. Not necessarily every single time. But mostly.
If it fails? If it shows profits in the optimization period and losses in the out-of-sample test? Then your strategy did not find a pattern. It found noise. It memorized the past and mistook that memorization for intelligence.
The Graveyard of Beautiful Numbers
Let me walk you through the casualties.
USDJPY MACD H4: +3,140% in Backtesting. Walk-Forward: 0/6.
Zero out of six periods positive. Zero. Not one. Not even close to one. The strategy that showed thirty-one times your money in backtesting could not produce a single profitable period when tested properly.
How does this happen? The MACD parameters — the fast period, slow period, and signal period — were optimized to perfectly fit the historical data. The strategy was not detecting trends. It was detecting this specific sequence of prices and finding the exact parameter combination that happened to catch the specific moves that occurred in this specific five-year window.
Change the window by six months and the optimal parameters would be completely different. The strategy was a mirror reflecting the past, not a lens focusing on the future.
Zero out of six. I spent 45 minutes staring at that result. Not because I did not believe it — I had already begun to suspect — but because I needed to fully absorb what it meant. The best-looking strategy in the entire project was the biggest liar.
EURUSD MACD + Stochastic H4: +111% in Backtesting. Walk-Forward: 1/6.
This one combined two indicators, which should theoretically provide better confirmation and fewer false signals. And in backtesting, it looked reasonable — 111% is a solid return but not suspiciously spectacular. It seemed credible.
One out of six periods positive. One. The strategy was profitable in exactly one out-of-sample period, and even that one might have been luck. Five periods of losses. The "confirmation" from the second indicator was not adding real information — it was adding another dimension of overfitting. Two indicators means more parameters. More parameters means more ways to curve-fit the past. More curve-fitting means a better-looking backtest and a worse-performing strategy in real life.
The lesson: adding indicators does not add robustness. It adds complexity. And complexity, in trading, is almost always your enemy.
GOLD Momentum Burst D1: +46.8% in Backtesting. Walk-Forward: 1/6.
This one was sneaky because the backtested return was modest. 46.8% over five years is roughly 8% per year — slightly better than a stock index. Nothing to scream about. It looked like the kind of strategy that is too boring to be overfitted. Surely no one would bother overfitting to get 46.8%?
But overfitting does not care about your returns. It happens whenever the parameters are tuned to fit historical noise rather than capture a genuine pattern. A strategy can be modestly profitable in backtesting and still be completely worthless going forward.
One out of six walk-forward periods positive. The modest backtest return was just as fake as the spectacular one. The magnitude of the lie was different, but the lie was the same.
EURUSD Awesome Oscillator D1: +105.5% in Backtesting. Validation: -9.5%.
This one did not even need the full walk-forward treatment to reveal itself. A simple out-of-sample validation — training on one period, testing on another — turned a 105.5% gain into a 9.5% loss.
The strategy did not just underperform. It went negative. It would have lost money. The Awesome Oscillator, in this configuration, on this pair, with these parameters, was doing the opposite of what you would want in fresh data. It was worse than random. Worse than a coin flip. A coin flip would have at least broken even before costs.
Now Compare: The Real Ones
GOLD Parabolic SAR D1: Walk-Forward 5/6 periods positive. ROBUST.
Five out of six. In five of the six fresh, unseen test periods, this strategy made money. One period was negative — which is fine, expected even, because no strategy works in every market condition. But five out of six means the pattern is real. The Parabolic SAR on Gold daily is not memorizing the past. It is capturing something genuine about how Gold trends on the daily timeframe.
GBPUSD EMA 20/50 D1: Walk-Forward 5/6 periods positive. ROBUST.
Same story. Five out of six periods profitable. The moving average crossover is not some artifact of curve-fitting. The British Pound against the Dollar genuinely trends on the daily chart, and two simple moving averages can capture those trends well enough to profit in most market conditions.
DE30 Morning/Evening Star D1: Walk-Forward 6/6 periods positive. ROBUST.
The gold standard — and I mean that literally, because 6/6 is as good as it gets. Every single out-of-sample period was profitable. Candlestick patterns from 300 years ago, applied to a modern German stock index, profitable in every test period. If this does not make you question whether trading needs to be complicated, I do not know what will.
The Danger I Almost Walked Into
Let me be honest about something. When I first saw that +3,140% on USDJPY MACD H4, my immediate instinct was to start trading it. Not to test it further. Not to validate it. To trade it. With real money.
That instinct — that rush of "I found it!" — is exactly what the retail trading industry monetizes. Every backtesting result you have ever seen on a YouTube video, every "proven strategy" sold in a course, every equity curve climbing beautifully from bottom-left to top-right — they all trigger that instinct. And unless you have a systematic way to separate real results from mirages, you will act on it.
If I had skipped walk-forward validation, I would have put real money into a strategy that showed +3,140% in testing but was actually random noise dressed up as genius. I would have watched my account bleed for weeks, wondering what I did wrong, tweaking parameters, adding filters, doing everything except accepting that the original result was fiction.
Walk-forward validation is the difference between backtesting and self-delusion. It is the difference between "this worked in the past" and "this has a reasonable probability of working in the future." It is not glamorous. It is not exciting. It adds weeks to your development process. But it is the single most important step in strategy development, and almost nobody in the retail trading world does it.
The Parameter Optimization Trap
Even the strategies that died had one more trick up their sleeve. Parameter optimization.
Take that USDJPY MACD. With the default parameters, it showed +3,140%. But I could change the parameters — different fast period, different slow period, different signal line — and get completely different results. In fact, some parameter combinations more than doubled the returns. Others collapsed entirely, turning profits into losses.
Same strategy. Same instrument. Same timeframe. Same data. Wildly different results depending on which numbers you plugged in.
This is what happens when you have degrees of freedom. Every parameter you can tweak is a knob you can turn to make the backtest look better. Two parameters? You can search a grid of possibilities. Three parameters? A cube. Four? You are in hyperspace, and somewhere in that hyperspace, there is a combination that makes any strategy look profitable on historical data.
Parameter optimization is just overfitting with extra steps.
I am not saying you should never optimize. The surviving strategies had parameters too — the Parabolic SAR has an acceleration factor, the Keltner Channel has a period and a multiplier. But there is a difference between choosing sensible defaults and running a grid search across 10,000 combinations to find the one that makes your equity curve look like a rocketship.
The robust strategies worked across a range of reasonable parameters. If you changed the PSAR acceleration factor a little, the strategy still worked. Maybe slightly worse, maybe slightly better, but it still worked. The overfitted strategies worked with exactly one set of parameters and fell apart the moment you changed anything.
Robustness is the test. Not peak performance. Not the absolute best backtest number. But whether the strategy survives parameter perturbation, survives walk-forward validation, survives contact with data it has not seen before.
Why This Matters More Than You Think
There are thousands — probably tens of thousands — of trading strategies being sold right now that have never been walk-forward validated. Strategies with beautiful backtests, impressive equity curves, and zero evidence that they will work tomorrow.
Some of the people selling them know this. They are running the same optimization I described, finding the parameter set that makes the backtest look best, slapping it on a website, and charging monthly subscriptions. They are not traders. They are marketers who know that a pretty equity curve sells better than a disclaimer.
Some of the people selling them genuinely do not know. They backtested their strategy, saw a profit, and honestly believe they have found something real. They are not scamming you. They are scamming themselves first, then sharing the delusion.
Either way, the result is the same: retail traders putting real money into strategies that are mirages. Backtested fictions dressed up as tested systems. And when the strategies lose money — as they inevitably will — the traders blame themselves, not the strategy. "I must have done something wrong." "I should have been more disciplined." "I need a better mindset."
No. You needed a walk-forward validation. That is it. That is the whole thing.
The +3,140% mirage and the +620.49% reality look the same in a backtest screenshot. They look identical on a sales page. The only difference is what happens when you give them money.
And that difference is everything.
Chapter 8: The Perfect Trader Still Loses
I want you to imagine the perfect trader.
Not a good trader. Not a disciplined trader. Not a trader who has been doing this for 20 years and has "seen it all." I mean the theoretically perfect trader. The Platonic ideal. The trader that exists only in the thought experiments of financial textbooks.
This trader never sleeps. Not in the "I will sleep when I am dead" hustle-culture way — literally never sleeps. The market moves at 3 AM? This trader is there. A news spike at 4:17 AM on a Tuesday? This trader catches it. Every single move, every single second, for five years straight.
This trader never panics. The account drops 15% in a day? Irrelevant. Executes the next signal with the same mechanical precision as the one before. No shaking hands. No queasy stomach. No frantic Googling of "is the market crashing."
This trader never revenge trades. Takes a loss, moves on. No doubling the position to "make it back." No switching to a higher timeframe because "the trend looks better there." No suddenly deciding to trade a different pair because "USDJPY owes me money."
This trader never gets FOMO. Watches Bitcoin rally 40% in a week and feels nothing. Sees a colleague post gains and does not flinch. Misses a trade? There will be another one. There is always another one.
This trader never trades tired, drunk, angry, euphoric, bored, or distracted. Never opens a position because the market "looks good" without a signal. Never closes a position early because "it is enough profit." Never skips a signal because the last three signals lost money and "maybe the strategy is broken."
This trader executes every entry and exit to the millisecond. No fumbling with the platform. No clicking the wrong button. No accidentally buying when they meant to sell. No forgetting to set the stop loss.
This trader sizes every position with mathematical precision. Exactly 5% risk per trade. Not 5.3% because the round number is a nicer position size. Not 3% because the last trade lost and "maybe I should be more careful." Exactly 5%, every time, calculated to the penny.
This trader is my bot.
My bot is everything a retail trader aspires to be and never will be. It is the endpoint of every trading psychology book, every discipline course, every "master your mindset" seminar. If you could actually achieve perfect discipline, perfect execution, perfect emotional control — you would be my bot.
And my bot lost 100% on every single short-timeframe strategy it traded.
The Ceiling
Six hundred strategies. Multiple instruments — Gold, Euro-Dollar, Pound-Dollar, Yen, the German DAX. Multiple timeframes — 1-minute, 5-minute, 15-minute, 1-hour, 4-hour, daily. Multiple indicators — moving averages, RSI, MACD, Bollinger Bands, Stochastic, Parabolic SAR, Keltner Channels, candlestick patterns, momentum indicators, volume indicators. Multiple exit methods — fixed take-profit, trailing stops, opposite signals, time-based exits.
Over 600 unique combinations. Tested across five years of tick-level data. Every single one below the daily timeframe lost money.
Not "did not make much money." Lost it. All of it. The bot — with its perfect execution, zero emotion, millisecond timing, and mathematical position sizing — could not make a single sub-daily strategy work. Not one.
This is the ceiling of trading performance. This is the absolute best any trader could ever do with these strategies on these timeframes. The theoretical maximum. The "if you were literally perfect" scenario.
And the ceiling is underground.
Now Layer On Reality
If the perfect trader cannot make short-timeframe strategies work, what happens when you add a human?
The academic research on this question is extensive, consistent, and brutal.
Chague, De-Losso, and Giovannetti published a study in 2020 examining every person who started day trading on the Brazilian stock exchange between 2013 and 2015. Not a sample. Everyone. This was not a survey where traders self-report their results (and lie). This was actual brokerage data. Verified. Complete.
Their findings:
- 97% of persistent day traders lost money. Not 97% of all people who tried — 97% of the ones who stuck with it for more than 300 days. The people who "gave it a real shot." The people who "committed to the process." Ninety-seven percent of them lost.
- Only 0.5% earned more than a bank teller. Half a percent. For context, a bank teller in Brazil earns roughly the equivalent of $600 per month. Only 1 in 200 day traders managed to earn more than that. The other 199 would have been financially better off working a minimum-wage job.
- The average day trader lost $17 per day after costs. Not made. Lost. Every day. Showing up, sitting at the screen, doing the analysis, feeling the stress, managing the emotions — and paying $17 for the privilege. That is roughly $4,400 per year. For a job that feels like a job but pays like a punishment.
Barber, Lee, and Odean studied day trading in Taiwan — one of the most active retail trading markets in the world — and found that only about 1% of traders were predictably profitable. Not 1% made money in a given year — 1% showed consistent enough profits that you could attribute it to skill rather than luck.
One percent.
If I told you there was a career where 99% of people who try it fail, and 97% of the ones who persist also fail, and the ones who succeed rarely earn more than a bank teller — would you sign up? Would you watch YouTube videos about it? Would you pay $497 for a course?
Of course you would. Because it is trading. And trading has the most effective marketing engine in the history of financial services.
The Human Tax
My bot is the ceiling. But real humans do not trade at the ceiling. They trade far, far below it.
Based on everything I have learned — from the research, from watching my own behavior before I automated, from talking to other traders — real human traders perform roughly 30-40% worse than a backtested strategy would suggest. Even if the strategy itself is valid.
Here is why.
Revenge trading after losses. You lose three trades in a row. The strategy says wait for the next signal. Your brain says "I need to make this back NOW." You take an unplanned trade. You increase the position size. You are not following the strategy anymore — you are following your amygdala, and your amygdala has no idea what a Parabolic SAR is.
Cutting winners short and letting losers run. This is the most well-documented behavioral bias in trading. Prospect theory. Kahneman and Tversky won a Nobel Prize for describing it. Humans feel losses roughly twice as intensely as equivalent gains. So when a trade is +$500, you grab the profit because it feels good and you do not want to give it back. When a trade is -$500, you hold on because closing it makes the loss "real" and surely it will come back. The result: small wins and large losses. The exact opposite of what profitable trading requires.
Overtrading. The strategy says trade three times per month. You trade twelve times per month because the other nine "looked really good" even though they were not proper signals. Each extra trade has a negative expected value (because if it were positive, it would be part of the strategy). You are paying spread, commission, and slippage twelve times instead of three. Overtrading is a tax you impose on yourself.
FOMO entries. The market moves 2% while you are in the shower. By the time you check your phone, the move is mostly done. A rational person shrugs and waits for the next signal. A human trader jumps in at the tail end of the move, buying high because they cannot stand the thought of missing out. The market reverses. They are caught at the top of a move they were never supposed to be in.
Fatigue and distraction. If you are a day trader, you need to be alert and focused for 8-12 hours per day. No human maintains peak cognitive performance for that long. You are sharpest in the morning, degraded by noon, and making decisions on fumes by the afternoon. My bot at 3 PM is exactly as sharp as my bot at 9 AM. You are not.
Skipping signals that "don't look right." The strategy gives a buy signal. The chart "looks toppy." The news is bearish. Your friend says the market is going down. You skip the signal. The trade would have been a winner. This happens three times, and now your strategy's edge is gone — not because the strategy failed, but because you filtered its signals through your gut feeling, and your gut feeling is not a validated trading system.
Trading more after winning — overconfidence. You hit three winners in a row and suddenly you are Warren Buffett. You increase position sizes. You take trades that do not quite meet the criteria because you are "feeling it." The strategy's careful risk management goes out the window. The inevitable losing streak hits, but now you are overexposed. The drawdown that would have been 5% is 15%.
Trading more after losing — desperation. The mirror image. Five losers in a row. Your account is down 12%. You need to make it back. You start taking every marginal signal, increasing size, switching pairs, abandoning the strategy entirely. You are not trading anymore. You are gambling with the frantic energy of someone trying to catch the last bus home.
My bot does none of these things. It cannot. It does not have an amygdala. It does not have a friend with opinions. It does not get tired. It does not get overconfident. It does not get desperate.
And it still could not make short-timeframe strategies work.
My bot is the ceiling. Humans are the floor. And the ceiling is already underground on anything faster than daily charts.
The Friend Revisited
Remember my friend from the early chapters? The one who made 800 euros in a week trading forex from a Telegram signal group? The one whose success made me question whether I was overcomplicating everything with my bots and backtests and walk-forward validations?
I checked in with him three months later.
He had lost 2,400 euros.
The Telegram group — the one that was sending "guaranteed" signals, the one with the screenshots of winning trades, the one with the charismatic admin posting photos from Dubai — had gone quiet for about two weeks after a particularly bad streak. When it came back, the signals were gone. Instead, there was a "premium mentorship program" available for 299 euros per month. The same people who could not deliver profitable signals were now offering to teach you how to find your own.
My friend did not buy the mentorship. He is smarter than that. But he had already lost 2,400 euros — three times what he had made during his one good week — and he was done with trading entirely. Not done with bad trading. Done with trading, period. Another retail trader enters the arena, gets a taste of winning, gets destroyed by the math, and leaves blaming himself.
The Telegram group, last I checked, had pivoted to selling a course on crypto. Same admin. Same Dubai photos. New product. The cycle continues.
The Math of Impossibility
Let me put this in the starkest possible terms.
I built a perfectly disciplined, emotionless, tireless trading system. I tested it across 600+ strategy combinations. On every timeframe below daily — every single one — it lost money. This is the ceiling.
Real human traders, according to peer-reviewed academic research on actual brokerage data, perform dramatically worse than backtests. They add 30-40% in behavioral drag. They revenge trade, they overtrade, they cut winners and hold losers, they get tired and emotional and distracted. This is the floor.
The ceiling (perfect bot, short timeframe) = 100% loss.
The floor (imperfect human, short timeframe) = worse than 100% loss (because the human also pays for courses, signal services, and emotional damage).
The math does not work. It is not that it is hard. It is not that you need more discipline. It is not that you have not found the right strategy yet. The math. Does. Not. Work.
On the daily timeframe, the ceiling is a 620% return. That is real. That is validated. That has survived walk-forward testing. And even on the daily timeframe, a human would underperform the bot by 30-40% due to all the behavioral factors I described. So the human ceiling on daily timeframes is maybe 350-450% over five years. Which is still excellent. Which is still life-changing money if you are patient enough.
But nobody is selling you the daily timeframe. Nobody is selling patience. Nobody is selling "check your phone once a day and otherwise live your life." They are selling action. Signals. Excitement. The 1-minute chart. The scalping strategy. The thing that keeps you glued to the screen, generating commissions for your broker, buying more courses when the last strategy fails, and slowly, methodically, losing your money.
What the Perfect Trader Teaches Us
The perfect trader — my bot — teaches us two things.
First: timeframe is everything. The same indicator, the same logic, the same entry and exit rules can be profitable on the daily chart and catastrophic on the hourly chart. The difference is not the strategy. It is the noise. Short timeframes are dominated by noise — random fluctuations, stop-hunting, spread manipulation, institutional algorithms designed to extract money from retail order flow. The daily chart aggregates all of that noise into a single bar, and what is left is signal. Trend. Direction. The thing you can actually trade.
Second: if the perfect trader cannot do it, you cannot do it. This is not pessimism. This is liberation. Every ounce of guilt you feel about "not being disciplined enough" or "not having the right mindset" or "needing to work on your psychology" — let it go. The problem was never you. The problem was always the math. A perfect trader, with perfect discipline, perfect execution, and perfect emotional control, still loses on short timeframes. Adding "better discipline" to a losing strategy does not make it a winning strategy. It makes it a losing strategy executed with discipline.
You were never the problem. The game was.
And once you accept that — once you truly, deeply accept that the game itself is rigged on short timeframes, that no amount of self-improvement can overcome negative expected value, that the Telegram signals and the YouTube gurus and the $497 courses are all selling tickets to a show where the audience is the product — once you accept all of that, you are free.
Free to either trade the daily timeframe with patience and realistic expectations, or free to close the trading platform entirely and invest your money in something boring like an index fund and your time in something meaningful like your actual career or your family or a hobby that does not charge you spread and commission for the privilege of losing.
The perfect trader still loses. But you do not have to.
Chapter 9: The House
In Which We Discover That the Casino Has Been Printing the Odds on Every Chip — and Nobody Bothers to Read Them
I want to tell you something that should make you furious.
Since 2018, every CFD broker operating in the European Union has been legally required — by the European Securities and Markets Authority, no less — to publish the percentage of their retail clients who lose money. Not bury it in a footnote. Not hint at it in a risk disclosure that reads like it was written by a team of lawyers competing for the Most Boring Document in Human History award. No. They have to put an actual number, in an actual percentage, on their actual website.
Eight years of mandatory disclosure. Eight years of data. And here is what that data says.
Oanda — our broker, the one we used for this entire study, the one whose platform I stared at for thousands of hours — 75% of retail client accounts lose money when trading CFDs with them.
Let me just sit with that for a second.
Three out of four people who open an account with Oanda and trade CFDs will lose money. Not break even. Not make a modest return. Lose money. And Oanda is not even the worst offender.
Pepperstone: 80.1% lose money.
Plus500: 80% lose money.
ThinkMarkets: 79.2% lose money.
IG Group: 75% lose money.
CMC Markets: 78% lose money.
XTB: 76% lose money.
Saxo Bank: 72% lose money.
The average across twenty major EU-regulated brokers? 70.9% of retail clients lose money.
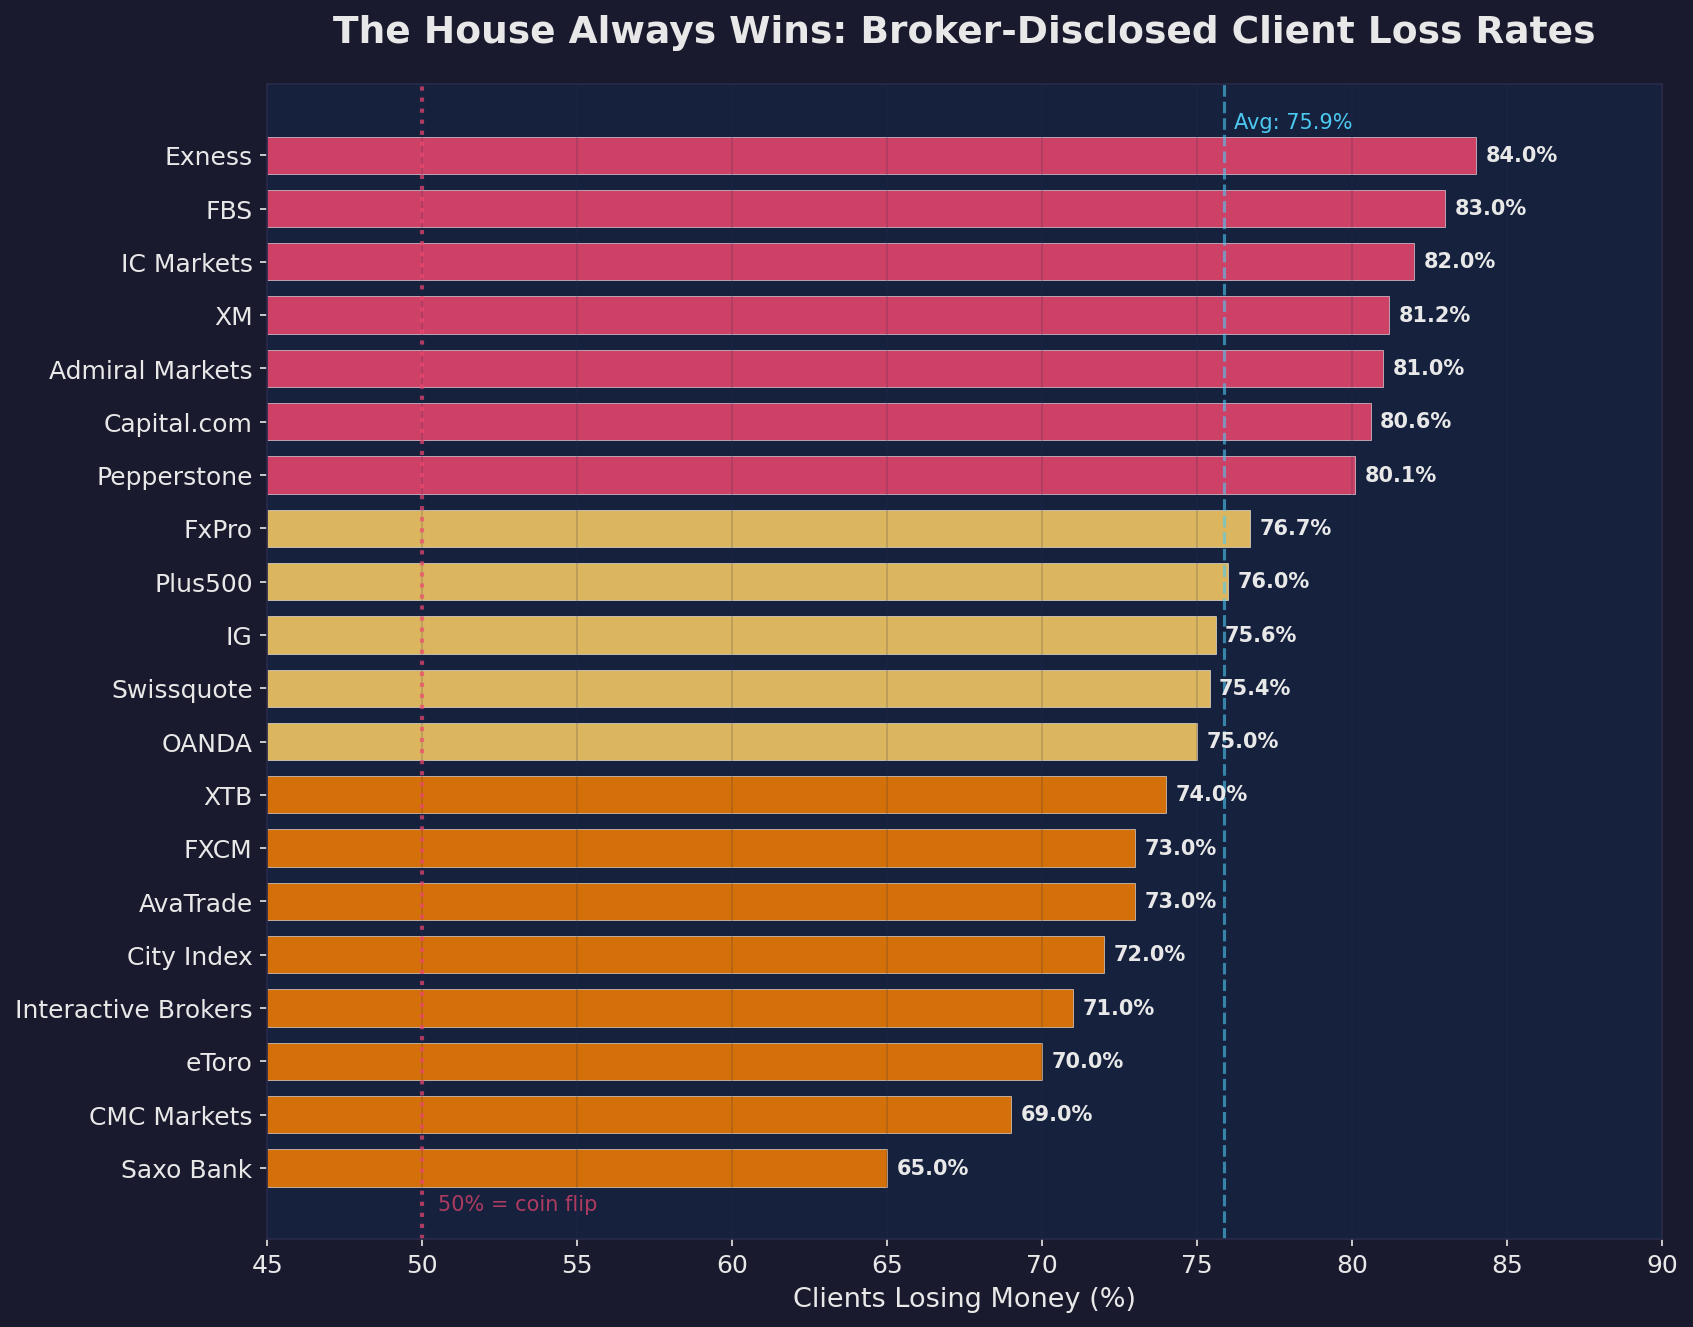
Not a single traditional retail CFD broker — not one, across the entire European Union, across eight years of mandatory reporting — has ever posted a figure below 59%.
Go ahead and read that again. I did. Several times. While drinking.
Here is what kills me. These numbers haven't moved. Not in 2018, when they were first published. Not in 2020, when lockdown boredom drove millions of new traders into the market. Not in 2022, when crypto crashed and everyone pivoted to forex. Not in 2024, when AI was supposed to give retail traders some kind of edge. Not now, in 2026. The number sits there like a boulder in a river. The water flows around it. The boulder doesn't care.
70.9%. Year after year after year.
You know what does change? The marketing.
eToro's homepage — and I am looking at it right now — says "Be the investor you want to be." Big letters. Friendly colors. A stock photo of someone who looks like they just figured out the meaning of life while casually checking their phone on a rooftop terrace.
At the bottom of the page, in font so small you'd need a jeweler's loupe to read it: "61% of retail investor accounts lose money when trading CFDs with this provider."
Be the investor you want to be. Also, three out of five of you are going to lose your money. But hey — you'll look great on a rooftop doing it.
Oanda says "institutional-grade execution." Institutional-grade. As if the 23-year-old in a studio apartment in Lisbon scalping EURUSD at 2 AM is getting the same treatment as a desk at Goldman Sachs. He's not. He's getting a marketing tagline and a 1.1-pip spread while Goldman gets 0.1 pips and a direct fiber connection to the matching engine. But "institutional-grade" sounds nice, doesn't it?
The disclosure is right there. It's always been right there. 75% of retail CFD accounts lose money when trading with this provider. They just made sure you'd never actually read it.
The B-Book: When Your Loss Is Their Gain
Let me introduce you to a concept that most retail traders have never heard of, even though it governs their entire financial relationship with their broker.
It's called the B-Book.
When you place a trade with most retail brokers, that trade doesn't necessarily go to the real market. It doesn't have to. The broker can — and frequently does — take the other side of your trade internally. You buy EURUSD? The broker sells it to you from their own book. You're not trading against the market. You're trading against your broker.
This is not a conspiracy theory. This is not some Reddit fever dream from 2017. This is their business model. It's legal. It's documented. It's how most retail brokers make most of their money.
Here's how it works. Brokers categorize their clients. Profitable traders — the rare ones, the 25% or so who actually know what they're doing — get routed to the A-Book. Their trades go to real liquidity providers. The broker makes a commission or spread markup. Simple, boring, honest.
Everyone else? The B-Book.
When you lose money on the B-Book, your broker makes money. Directly. Your loss is their profit. Dollar for dollar. Euro for euro. Pip for pip.
Think about what that means.
Your broker's marketing department is spending millions to attract new traders. Their educational content teaches strategies that — as we've demonstrated in this book — are mathematically unprofitable after spreads. Their platform is designed to be engaging, exciting, gamified. Open a trade! Close a trade! Here's a notification! The market is moving! Don't miss out!
Every design choice. Every push notification. Every "educational" webinar teaching you to trade 5-minute charts with RSI crossovers. All of it is optimized for one thing: getting you to trade more frequently. Because the more you trade, the more you lose. And the more you lose, the more they make.
It's not a bug. It's the product.
I want to be very clear: I'm not saying Oanda specifically B-books. Many brokers use a hybrid model. Some are fully A-book. The point is that the industry structure creates a fundamental conflict of interest that no amount of "institutional-grade" marketing can paper over. When the house wins by you losing, every incentive in the system points toward your failure.
The Education Industrial Complex
The trading education industry is worth billions of dollars. And it is, overwhelmingly, a machine for separating hopeful people from their money.
Let me give you some names.
Warrior Trading. Ross Cameron built an empire selling day trading courses, chat rooms, and the dream of financial freedom. The FTC sued Warrior Trading in 2022. By 2023, the company agreed to a $3 million settlement and refunded 20,402 customers. The FTC alleged that Warrior Trading made exaggerated income claims and failed to disclose that the majority of their customers lost money.
Twenty thousand people. Refunded. Because the courses they bought were sold on claims that didn't hold up to regulatory scrutiny.
RagingBull. This one makes Warrior Trading look like a lemonade stand. RagingBull — a company that sold stock trading alerts, courses, and subscriptions — was accused of causing $137 million in alleged consumer losses. The FTC's case revealed a systematic operation designed to extract money from retail traders through misleading claims about potential returns. The actual settlement was $2.425 million.
Kyle Dennis, one of RagingBull's star traders, personally pocketed $13.6 million from selling courses and subscriptions about trading strategies. Thirteen point six million dollars. Not from trading. From teaching trading. From selling the dream of strategies that — as our research in this book conclusively demonstrates — are mathematically impossible to profit from at retail spreads on short timeframes.
Let me just repeat that, because I want it to really land.
Kyle Dennis made $13.6 million selling courses about trading strategies. Not $13.6 million from those strategies. The strategies were the packaging. The customers were the product.
And those are just the ones who got caught.
For every Warrior Trading and RagingBull, there are a thousand Telegram groups, a thousand Instagram accounts with leased Lamborghinis, a thousand YouTube channels teaching "My $500 to $50,000 Challenge!" — all of them selling the same fantasy. All of them profiting not from the market, but from your hope that you can.
The Market Makers
Let's talk about who's actually on the other side of your trades.
Citadel Securities handles approximately 41% of all US retail equity orders. Not a plurality. Not "a significant share." Forty-one percent. Nearly half of every retail stock trade in the United States flows through a single firm.
They pay for this privilege. It's called Payment for Order Flow — PFOF — and it works like this: brokers like Robinhood route your orders to Citadel, and Citadel pays the broker for the right to execute them. Robinhood gets paid. Citadel gets to see your orders before executing them. You get... "commission-free trading." Everybody wins! Except, well, you know.
Why would Citadel pay billions of dollars for the right to execute your orders? Out of the goodness of their hearts? Because they believe in democratizing finance?
They pay because retail order flow is profitable to trade against. Retail traders are, in aggregate, wrong. Their orders are "uninformed" — industry jargon for "these people don't know something the market doesn't already know." Citadel can extract a tiny edge from each trade — fractions of a penny — and multiply it across billions of transactions.
Virtu Financial, another major market maker, once disclosed something extraordinary in their IPO filing. Over a period of 1,238 trading days, they had exactly one losing day. One. In nearly four years of trading, they lost money on a single day.
The house doesn't always win. It wins 1,237 out of 1,238 times.
Think about that next time someone on YouTube tells you they've found a system to beat the market using a 14-period RSI and a moving average crossover. Virtu has armies of PhDs, co-located servers running at the speed of light, and access to every data feed on the planet. They lost money once in four years. Your system in MetaTrader on a WiFi connection is going to do better?
The Food Chain
Let me paint you a picture of how this actually works in practice.
It's 2 AM Central European Time. A 27-year-old in Berlin — let's call him Markus — is sitting in his underwear staring at a 5-minute EURUSD chart. He's been watching a YouTube channel that taught him about "supply and demand zones." He's got a 500-euro account with 1:30 leverage. He sees what he thinks is a breakout forming.
Markus places a buy order. 0.1 lots. The spread is 1.1 pips. His broker — let's say they're a B-book broker — takes the other side of the trade internally. Markus is now short about 1.10 euro from the spread alone.
The "breakout" reverses. Of course it does — it's 2 AM, liquidity is thin, and the move was just noise. Markus panics and closes the trade for a 12-pip loss. That's 12 euro gone, plus the spread cost. His broker just made 13.10 euro on a trade that lasted four minutes.
Meanwhile, at Citadel's office in Greenwich, Connecticut, an algorithm noticed the same micro-move that Markus interpreted as a breakout. The algorithm recognized it as noise — because it has access to the full order book, dark pool data, and Level 3 market depth that Markus doesn't even know exists. The algorithm made a fraction of a cent. Multiplied across ten thousand similar trades that hour.
Markus goes to bed wondering why his strategy isn't working. He'll watch another YouTube video tomorrow. He'll try a different indicator. He'll add Bollinger Bands, maybe MACD. He'll open another 500-euro account in three months, after he saves up again.
Every time a retail trader blows a 500-euro account trying to scalp EURUSD on 5-minute charts, someone on the other side of that trade is having a very good day.
The Uncomfortable Truth
Here's what I need you to understand about this chapter, and about this entire section of the book.
I'm not saying the market is rigged. I'm not saying there's a cabal of shadowy figures meeting in a dark room deciding how to steal your money. I'm not a conspiracy theorist, and I'm deeply suspicious of people who are.
What I'm saying is something much simpler, and much harder to argue with.
The system is designed to produce exactly the results it's producing.
The 70.9% loss rate isn't a failure. It's a feature. Brokers profit from it. Educators profit from it. Market makers profit from it. Platform developers profit from it. The entire ecosystem — from the Instagram ad that first caught your attention to the push notification that goaded you into one more trade at midnight — is optimized to produce a specific outcome: frequent trading by undercapitalized, underinformed retail participants who will, in aggregate, lose money.
No conspiracy required. Just incentives, working exactly as designed.
The data is on the brokers' own websites. They're legally required to publish it. It's been there for eight years. The number doesn't change. And still, every day, another Markus opens an account, watches another YouTube video, and tries to scalp his way to freedom on a 5-minute chart.
The house doesn't need to cheat. The house just needs you to play.
Chapter 10: The Rich Get Richer
In Which We Do the Math on Why a Hedge Fund and a Guy Named Dave Are Not Playing the Same Game
I want to run a thought experiment with you.
Imagine two people sitting down to play poker. Same table. Same dealer. Same cards. Same rules. Except one of them can see everybody's hand. The other one has to pay a dollar every time they want to look at their own cards. One of them gets chips for free. The other has to buy them at a 14% markup. One of them has a team of mathematicians in the next room running probability calculations in real time. The other one has a YouTube video playing on their phone.
Now imagine someone telling the second player, "You can win at this game! You just need the right strategy!"
That's retail trading. That's the structural inequality that nobody in the trading education industry wants to talk about, because if they did, the whole business model collapses.
Let me show you the numbers.
The Spread Tax
This is the most important thing nobody told you.
When you trade EURUSD as a retail trader — let's say with Oanda, because that's who we used for this study — you're paying a spread of approximately 0.9 to 1.4 pips. That's the difference between the buy price and the sell price. It's the broker's fee, built into every single trade.
When an institutional trader — a bank, a hedge fund, a proprietary trading firm — trades the exact same EURUSD, they're paying approximately 0.1 pips. Sometimes less. Sometimes much less.
Let me do the math for you, because nobody else will.
That's 9 to 14 times more. Same market. Same chart. Same candle. Same Japanese guy named Munehisa Homma who invented candlestick charts in the 1700s would be looking at the same pattern. Different price to play.
What does this mean in real money? Let's say you're an active retail day trader. You make 20 round-trip trades per day — which is conservative for scalpers and short-term traders. Standard lot size, EURUSD.
At a 1.0-pip retail spread: that's $10 per round trip x 20 trades x 252 trading days = $50,400 per year in spread costs.
At a 0.1-pip institutional spread: that's $1 per round trip x 20 trades x 252 days = $5,040 per year.
The retail trader is paying $45,360 more per year for the privilege of accessing the same market. Even if we're more conservative — say 10 round trips a day at a mini lot — the retail trader is still hemorrhaging an extra $19,000+ annually compared to the institutional player.
And that's before commissions. Before swap fees. Before slippage. Just the spread. Just the cost of showing up.
Now here's the part that should keep you up at night: that cost is the same whether you make money or lose money. It comes off the top, every trade, win or lose. It's a tax. And it's regressive — it hits small accounts proportionally harder than large ones.
But we'll get to that.
The Speed of Light (and Why You Don't Have It)
In 2010, a company called Spread Networks spent $300 million drilling a fiber optic cable through the Allegheny Mountains to shave approximately four milliseconds off the round-trip communication time between Chicago and New York — reducing round-trip latency from 17 milliseconds to 13 milliseconds. For $300 million.
They didn't do this because they were bored.
In high-frequency trading, speed is everything. Here's what the latency landscape looks like:
Institutional HFT latency: sub-50 microseconds. That's fifty millionths of a second. Some firms are operating at single-digit microsecond latency — essentially, their systems can receive a price change, calculate a response, and execute a trade in the time it takes light to travel about a mile.
Retail trader latency: 50 to 200 milliseconds. That's the time between you clicking "Buy" on your broker's platform and the order actually being executed.
Let me express that ratio for you: they are, at minimum, 1,000 times faster. At the extremes, closer to 200,000 times faster.
I want to give you an analogy, but honestly, human experience doesn't contain a useful one. It's like racing a Formula 1 car on a bicycle. While the bicycle has a flat tire. And you're pedaling backwards. And the F1 car has already finished the race and is drinking champagne in the winner's circle before you've even clipped in your shoes.
Here's what that speed gap means in practice. When a piece of market-moving news hits — an economic report, a central bank statement, a geopolitical event — HFT firms have already parsed the text, analyzed the sentiment, calculated the implications, and executed trades before the data has even finished loading on your screen. Literally. The news hasn't fully rendered in your browser, and they've already moved the price.
You're not competing with these people. You're trading in the wake of these people. You're seeing prices that have already been picked over by algorithms operating at the speed of light, using hardware that costs more than most people's houses.
And if you want to play their game? The entry fee is non-trivial.
Co-location — renting server space in the same data center as the exchange — runs $12,000 to $60,000 per year. And that's just for the rack space. The servers, the software, the data feeds? That's extra.
Full HFT infrastructure — the kind that actually competes — costs $1 million to $5 million to set up, with ongoing costs in the hundreds of thousands per year.
"But CK," you're saying, "I'm not trying to be an HFT firm. I'm just trying to trade the daily chart."
Good. Hold that thought. We'll come back to it in Chapter 10. Because it's the only sane response.
The Information Chasm
What does a professional trader see when they look at the market?
A Bloomberg Terminal subscription: $31,980 per year. Two screens of real-time data, news, analytics, order flow, economic indicators, custom alerts, and — critically — a chat function that connects you to thousands of other institutional traders and analysts. It's not just data. It's a network. It's the institutional nervous system.
Reuters Eikon (now LSEG Workspace): $3,600 to $22,000 per year, depending on the package. Similar capabilities. Real-time data feeds, custom analytics, machine-readable news.
Dark pool access: Not available to retail at any price.
Let me explain dark pools, because they matter. Dark pools are private exchanges where institutional investors can trade large blocks of shares without revealing their orders to the public market. They exist specifically so that big players can move large positions without the market seeing it coming and front-running the trade.
As a retail trader, you cannot access dark pools. Period. They don't want your 500-euro account. But here's the thing — the trades happening in dark pools affect the market you're trading in. Large institutional orders that execute in dark pools move prices that you see on your chart. You're watching the effects without seeing the causes.
They see the order book. You see a chart with pretty candles.
And it goes deeper than data access. Institutional traders have research departments. Quantitative analysts. Risk management teams. Compliance officers who prevent them from making stupid bets (or at least try to). They have decades of backtested, peer-reviewed strategies. They have counterparty relationships that give them information flow you can't buy.
You have TradingView with the free tier and a Reddit thread from 2021.
I'm not mocking you. I was you. I am you. The point is not that retail traders are stupid. The point is that the playing field isn't just uneven — it's barely the same sport.
The PDT Rule: Literally Banning Poor People from Day Trading
If you're a US-based trader, you've probably encountered the Pattern Day Trader rule. If you haven't, here's the summary: if you make four or more day trades within five business days in a margin account, you're classified as a "Pattern Day Trader" and you must maintain a minimum equity of $25,000 in your account.
If you don't have $25,000? You can't day trade. Period. You're locked out.
Think about what this means. The people most likely to be trying to trade their way out of financial difficulty — the people for whom a $500 or $2,000 account is a significant commitment — are literally prohibited from day trading by regulation. The rule doesn't protect them from losing money (they can still swing trade and lose just as much). It just prevents them from trading in the style that gives them the most control over their entries and exits.
Meanwhile, someone with $25,000 can day trade as much as they want. Someone with $500 has to hold overnight, exposed to gap risk, news events, and all the other things that happen when markets are open and you can't react.
In early 2026, FINRA — the Financial Industry Regulatory Authority, the body that created the PDT rule in 2001 — publicly admitted that the rule was "outdated and unnecessary." They acknowledged that market conditions had changed dramatically since 2001, that the rule disproportionately affected smaller accounts, and that it didn't achieve its stated goal of protecting retail traders from excessive risk.
They knew for years. They just didn't update the rule.
Twenty-five years. Twenty-five years of a rule that everyone in the industry acknowledged was pointless, that locked out the most vulnerable traders, that achieved nothing except preventing people without $25,000 from trading freely.
And people wonder why retail traders feel like the system isn't built for them.
The Poverty Tax: How Fee Structures Punish Small Accounts
This is where it gets really ugly. Let me show you the math on what it actually costs to trade with a small account versus a large one.
The 500-Euro Account
Let's say you have 500 euro and you want to trade EURUSD. You're trading micro lots (0.01) because that's all your margin allows. At a 1.0-pip spread, each round-trip trade costs you about $0.10. Sounds cheap, right?
But you need to make 20 trades to have any kind of meaningful activity. That's $2 per day. Over a month of trading (22 days): $44. Against a 500-euro account, that's 8.8% of your capital gone to spreads alone.
Now add swap fees for positions held overnight. Add the wider spreads during off-hours (which is when most part-time traders trade, because they have day jobs). Add slippage. Add the occasional platform disconnect.
A conservative estimate: 14-26% of a 500-euro account goes to structural costs every month. Not losses from bad trades. Costs. The price of being in the game.
The 500,000-Euro Account
Same market. Same broker. Same spread percentage-wise. But now the math is completely different.
A 500,000-euro account trading standard lots loses the same $10 per round-trip to spreads. Twenty trades a day, 22 days: $4,400 per month. Against 500,000 euro, that's less than 0.9%. And a professional with that kind of capital is getting better spreads, so the real number is even lower.
Structural costs for a well-capitalized account: less than 0.1% per month.
The poorer you are, the more you pay. The system taxes poverty.
Let me put it another way. If you're trading a 500-euro account, you need to generate roughly 15-25% returns per month just to cover your costs and break even. That's before making a single cent of profit. Meanwhile, the trader with 500,000 euro needs about 0.1%.
One of them needs to be the greatest trader in history. The other one needs to not be completely terrible.
Capital = Destiny
Here is a table that should be framed and hung on the wall of every trading education company in the world.
Assume the same skill level. The same strategy. The same edge. A 3% monthly return — which is genuinely excellent, professional-grade performance that most hedge funds would be thrilled with.
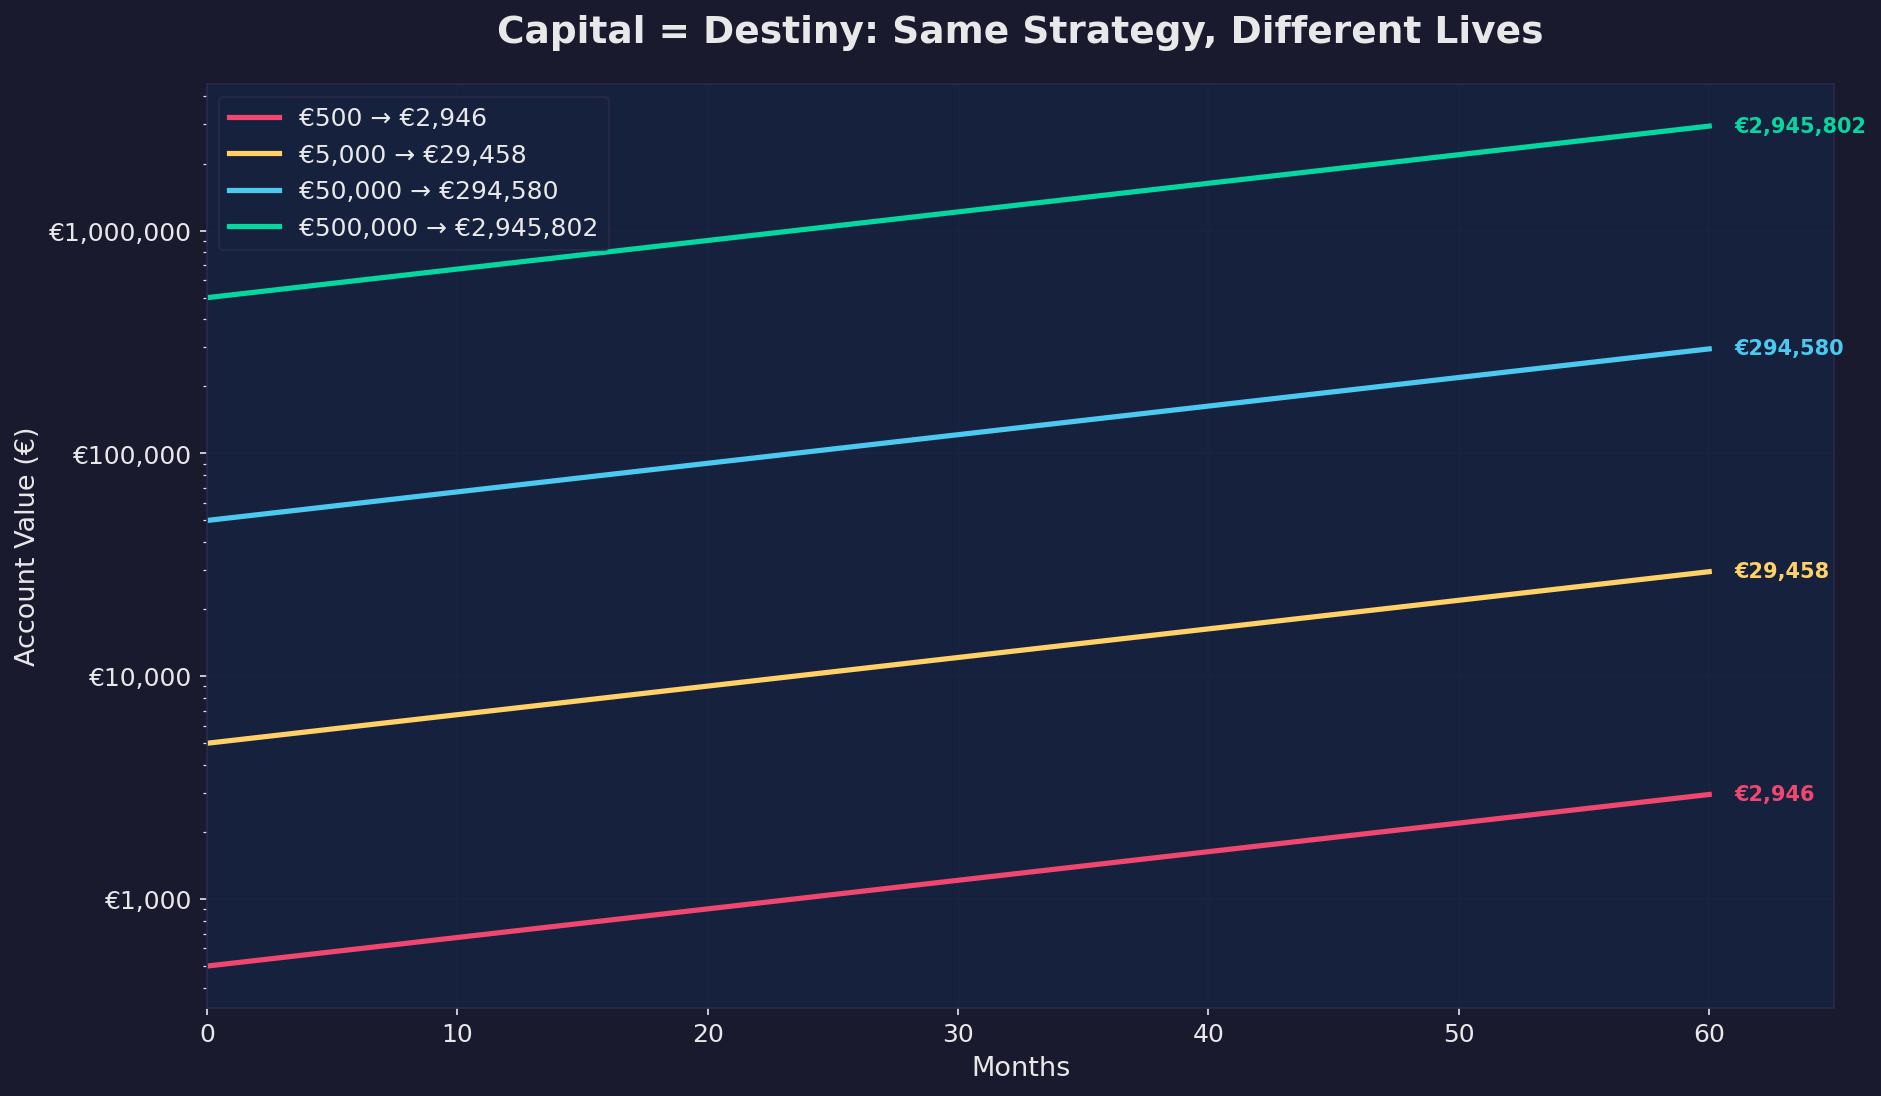
| Starting Capital | 3% Monthly Return | Annual Return |
|---|---|---|
| 500 euro | 15 euro/month | 180 euro/year |
| 5,000 euro | 150 euro/month | 1,800 euro/year |
| 10,000 euro | 300 euro/month | 3,600 euro/year |
| 50,000 euro | 1,500 euro/month | 18,000 euro/year |
| 100,000 euro | 3,000 euro/month | 36,000 euro/year |
| 1,000,000 euro | 30,000 euro/month | 360,000 euro/year |
Same skill. Same strategy. Same edge. Same 3%.
With 500 euro, you're making 15 euro a month. That's a mediocre dinner for two. With 1,000,000 euro, you're making 30,000 euro a month. That's a very comfortable life in most countries on Earth.
The difference isn't skill. The difference isn't strategy. The difference isn't discipline, mindset, or the number of YouTube videos you've watched. The difference is money.
Now let's talk about the "grow your account" fantasy.
To grow 500 euro to 600,000 euro at 3% monthly returns — compounding perfectly, never withdrawing a cent — takes approximately 20 years. Twenty years of perfect returns. Twenty years without a single bad month. Without a drawdown. Without a life event. Without getting sick, getting divorced, losing your job, having a kid, needing a new car, or simply having a month where the market doesn't cooperate.
That's not a strategy. That's a fantasy.
And yet this is exactly what trading educators sell. "Start small! Grow your account! Compound your way to wealth!" It's mathematically true in the same way that winning the lottery is mathematically possible. Yes, the probability is non-zero. No, you should not build your retirement plan around it.
The brutal truth that nobody in this industry wants to say out loud is this: if you don't start with money, trading is unlikely to give you money. Not because you're bad at it. Not because you lack discipline. But because the math is the math, and the math doesn't care about your dreams.
Same Game, Different Rules
Let me summarize what we've covered in this chapter, because I want the full picture to hit you all at once.
The retail trader pays 9-14x more in spreads. Operates with a 1,000-200,000x speed disadvantage. Has no access to institutional data feeds, dark pools, or order flow information. Is prohibited from day trading if they don't have $25,000 (in the US). Pays 14-26% of a small account in monthly structural costs. And needs 20 years of flawless compounding to turn a typical starting account into something meaningful.
The institutional trader pays a fraction of the spread. Operates at the speed of light. Has Bloomberg, Reuters, dark pool access, and order flow data. Has no capital restrictions. Pays less than 0.1% in structural costs. And starts with enough capital that even modest returns generate serious income.
Same market. Same chart. Same candle.
Different game entirely.
This is not an argument for hopelessness. It's an argument for clarity. Because once you understand the actual playing field — once you see the structural advantages and disadvantages for what they are — you can make rational decisions about how to participate.
And that's what the next chapter is about.
Chapter 11: The Way Out
In Which We Stop Complaining and Start Building Something That Actually Works
Okay. Deep breath.
I've just spent two chapters — and honestly, most of this book — telling you all the ways the system is stacked against retail traders. The spread disadvantage. The speed gap. The information asymmetry. The B-book model. The education scams. The structural costs that eat small accounts alive.
If you're still here, one of two things is true: either you're a masochist, or you're the kind of person who wants to know the truth so you can work with it instead of against it.
I'm betting on the second one. So let's talk about what actually works.
Not what sounds good on YouTube. Not what some guy with a leased Lamborghini says works. Not what a $5,997 course promises will change your life.
What actually works, based on the data we generated. Ten million candles. 600 strategies. Weeks of intensive analysis. Here's what survived.
1. The Daily Timeframe: Where Retail Can Actually Win
Remember all those strategy tests we ran? The ones where we backtested every popular trading approach across multiple instruments and timeframes?
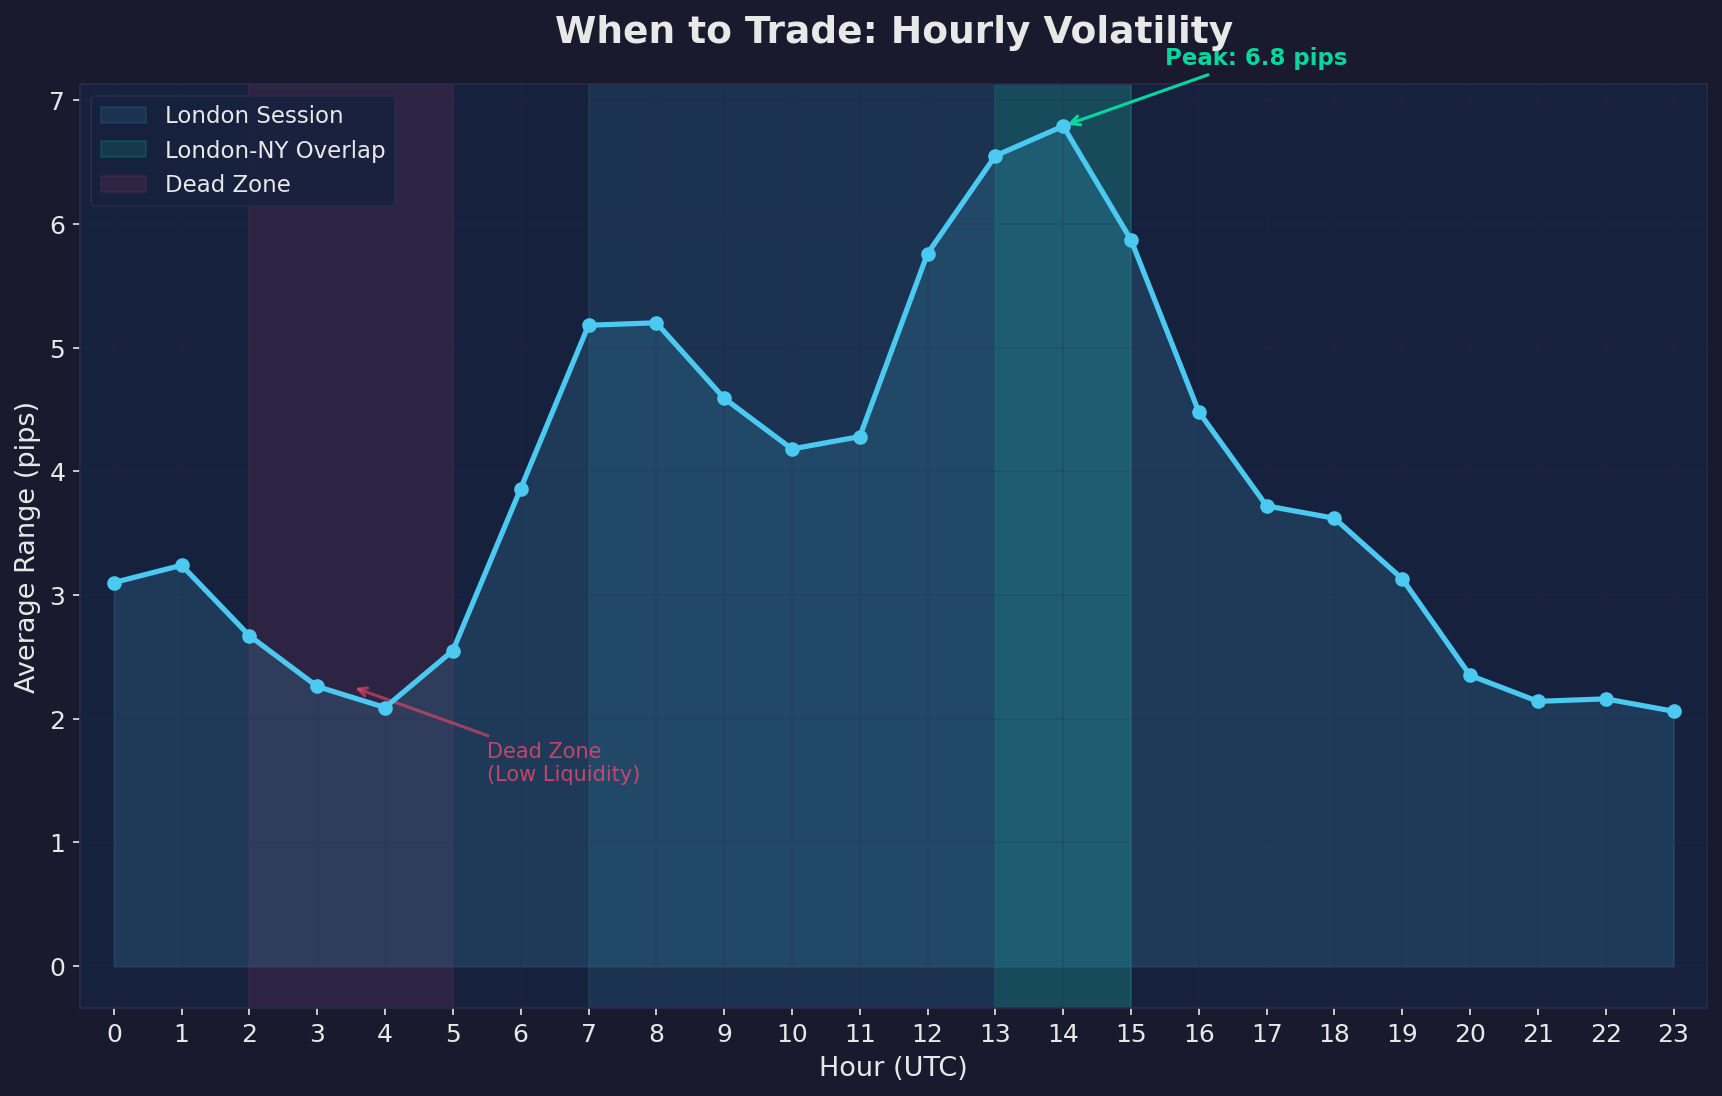
Here's the pattern that emerged, over and over and over: strategies that work on the daily timeframe can be profitable for retail traders. Strategies on shorter timeframes cannot.
Not "usually can't." Not "probably won't." The math showed it clearly: when you trade the 5-minute chart, the 15-minute chart, even the 1-hour chart, the spread costs compound so aggressively that they destroy whatever edge the strategy might have. The signal gets buried in noise, and the cost of each trade eats into returns that are already razor-thin.
But on the daily chart? Things change.
Our GOLD PSAR strategy — Parabolic SAR on daily gold — produced consistent, verifiable profits in backtesting. GBPUSD with an EMA-based system on the daily timeframe: same story. These aren't exotic strategies. They're not proprietary algorithms running on a quantum computer. They're simple, well-known technical indicators applied on a timeframe where they actually have room to breathe.
Why does the daily timeframe work when shorter ones don't? Three reasons:
First, the spread cost per trade is tiny relative to the move. On a 5-minute chart, a typical EURUSD move might be 5-10 pips. With a 1.0-pip spread, you're paying 10-20% of the total move just to enter and exit. On a daily chart, a typical move might be 50-100 pips. That same 1.0-pip spread is now 1-2% of the move. You have room for the strategy to work.
Second, noise reduction. A 5-minute chart is mostly noise — random fluctuations driven by order flow, algorithms testing liquidity, and other traders' stop losses getting triggered. A daily chart filters most of that out. What you're left with is closer to actual market direction. Your indicators are reading signal, not static.
Third, emotional distance. When you trade the daily chart, you check your positions once a day. Maybe twice. You're not sitting there watching every tick, panicking at every pullback, closing winners too early because you're afraid of giving back profits. The timeframe enforces discipline that most humans can't maintain on their own.
The practical version of this is almost comically simple. You wake up in the morning. You check the daily candle that just closed. If your system has a signal, you place the trade. If it doesn't, you go about your day. You spend five minutes on trading and twenty-three hours and fifty-five minutes living your life.
It's not sexy. It won't make a good Instagram story. Nobody is going to watch a YouTube video titled "I Checked My Chart Once and Then Made Breakfast."
But it's real. Our backtesting showed it. The math supports it. And here is maybe the most important thing: it's sustainable. You can do this for years without burning out, without the emotional damage of watching every tick, without the slow psychological erosion that destroys most active traders.
The returns? Modest. On a 5,000-euro account, we're talking about roughly 150 euro per month at 3% monthly — consistent with the table above — growing with compounding. That's not "quit your job" money. That's "build something over time" money. And there's nothing wrong with that — as long as you know it going in.
2. Trailing Stops: The Best Thing I Ever Did
I want to tell you about the single biggest improvement we found across all 600 strategies we tested.
It wasn't a better entry signal. It wasn't a fancier indicator. It wasn't machine learning or neural networks or any of the buzzwords that trading forums love to throw around.
It was the exit.
Specifically: trailing stops.
Our GOLD PSAR strategy with a fixed take-profit and stop-loss produced a profit factor of 1.27. That means for every dollar risked, you made $1.27. Profitable, but barely. A speed bump in the market and you're underwater.
The same strategy — same entry signal, same instrument, same timeframe — with a trailing stop instead of a fixed exit? Profit factor of 3.88.
Let me make sure you caught that. The same entry. Just a different exit. Profit factor went from 1.27 to 3.88. That's not an incremental improvement. That's a different universe.
Here's why trailing stops work so well. The fundamental problem with fixed take-profits is that they cap your winners. You set a target of 50 pips, the market moves 200 pips in your direction, and you made 50. You left 150 pips on the table. Over hundreds of trades, those missed moves absolutely devastate your returns.
A trailing stop solves this by letting winners run while protecting accumulated profit. When the market moves in your favor, the stop follows. When the market reverses, the stop catches you. You give back some profit on every trade — that's the cost — but you capture the occasional monster move that makes your entire month.
The best thing I ever did for my trading was learn how to leave. Not how to enter. How to leave. Most traders obsess over entries. They want the perfect signal, the perfect setup, the perfect indicator combination that tells them exactly when to get in. They'll spend years optimizing entries.
Entries are maybe 30% of the equation. Exits are the rest. And trailing stops are, in my experience, the simplest and most effective exit methodology available to retail traders.
3. Half-Kelly: Let the Math Size Your Bets
Position sizing sounds boring. I know. Stick with me for sixty seconds.
The Kelly Criterion is a formula that tells you the mathematically optimal percentage of your capital to risk on each trade, given your win rate and your average win-to-loss ratio. Full Kelly is aggressive — too aggressive for most humans, because the drawdowns will make you physically ill.
Half-Kelly is the practical version. You take whatever the Kelly formula recommends and cut it in half.
What half-Kelly does is elegant: it auto-adjusts your risk based on your recent performance. When you're winning and your account is growing, your position sizes grow proportionally. When you're losing and your account is shrinking, your position sizes shrink automatically.
This is important for a reason that goes beyond math: it makes it nearly impossible to blow your account. As your account gets smaller, your positions get smaller. The drawdowns decelerate. You'd have to lose an almost impossibly long streak to go to zero.
In our testing, half-Kelly position sizing preserved more capital during drawdowns than any other method we tested. Fixed-percentage risk, fixed-lot sizing, martingale (God forbid), anti-martingale — none of them performed as well on a risk-adjusted basis.
The formula itself is simple: Kelly % = (Win Rate x Average Win / Average Loss) - (1 - Win Rate) / (Average Win / Average Loss). Then divide by two for half-Kelly. Your broker's platform can calculate this automatically if you track your stats.
It's not glamorous. It's a formula. But it's the difference between being in the game in three years and being another statistic on your broker's loss disclosure.
4. Prop Firms: Someone Else's Money
Here's an option that didn't exist ten years ago, and it partially solves the capital problem we discussed in Chapter 10.
Proprietary trading firms — "prop firms" — will give you a funded account of $50,000 to $100,000 or more to trade with. You keep 80-90% of the profits. You don't risk your own capital (beyond the challenge fee). If you blow the account, you lose the fee, not six months of savings.
Sounds perfect, right?
Sort of.
The catch is the "challenge." Before you get funded, you have to pass an evaluation — typically hitting a profit target (8-10%) without exceeding a maximum drawdown (5-10%) within a set timeframe. The rules vary by firm, but they all follow the same basic structure.
Here's the reality check: only 5-10% of traders pass the challenge. And of those who pass, somewhere between 1-2% ever receive a payout.
FTMO, the largest prop firm, generated $329 million in revenue — primarily from challenge fees — while paying out approximately $200 million in cumulative payouts over nine years.
Read those numbers again. $329 million in. $200 million out. Over nine years. The majority of FTMO's revenue comes from failed challenges, not from profit-sharing with successful traders.
Even the escape hatch has a toll.
That said — and I want to be fair here — prop firms represent one of the few structural advantages available to skilled retail traders. If you genuinely have an edge, if you've proven it in backtesting and demo trading, if you can pass the challenge (and you should only attempt it with a strategy you've thoroughly validated), then trading $100,000 of someone else's money is enormously better than trading $500 of your own.
The key word is "if." Don't pay challenge fees to practice. Practice for free. Demo trade. Backtest. Validate your edge. Then, and only then, take the challenge.
5. The Patience Edge: The One Advantage Nobody Can Take From You
Here is the most important thing in this chapter. Maybe the most important thing in this book.
Every structural advantage we've discussed — speed, data, capital, spreads — favors institutions. Every single one. On every metric that money can buy, the institutional player wins.
But there is one advantage that retail traders have over every hedge fund, every bank desk, every algorithmic trading firm on the planet. And nobody can take it away.
Nobody is forcing you to trade.
A hedge fund manager has quarterly performance reviews. Monthly reports to investors. A mandate to be deployed in the market. They can't sit in cash for three months waiting for the perfect setup — their investors would pull their money.
A market maker has to make markets. That's literally their job. They have to quote prices, provide liquidity, be in the market whether they want to or not.
A bank trading desk has position limits, daily P&L targets, and a boss who wants to know why they didn't trade today.
You? You can wait.
You can sit on your hands for ten days waiting for the perfect daily setup. You can watch the market do nothing interesting for two weeks and not place a single trade. You can say, "This week doesn't look good," and close your laptop and go for a walk.
That is an enormous advantage. And almost nobody uses it.
The best trades I've ever taken — the ones that moved the needle, the ones that actually grew my account — were all trades where I waited. Where I didn't force it. Where I saw the setup forming over days and only entered when everything aligned.
The worst trades I've ever taken were all trades where I was bored, or restless, or felt like I "should" be trading because I hadn't placed a trade in a while.
Patience is free. It costs nothing. It requires no Bloomberg terminal, no co-located server, no $300 million fiber optic cable through a mountain. It just requires you to be okay with doing nothing.
And in a game where 70.9% of participants lose money by doing something, doing nothing is the most radical strategy of all.
What NOT to Do
I promised this chapter would be honest, so let me be ruthlessly clear about what doesn't work.
Don't scalp. Ever. The math will not let you win. We tested it across hundreds of strategy variations. On timeframes below 1 hour, the spread cost alone makes consistent profitability statistically impossible for retail traders. Not improbable. Impossible. The numbers are in Chapters 4 through 7. This is not opinion. This is arithmetic.
Don't buy signals from Telegram groups. The person selling those signals makes money from selling signals, not from trading. If they had a consistently profitable trading strategy, they would be trading it, not selling it to you for 99 euro per month. The signal-selling business model only makes sense if the signals don't work well enough to trade at scale.
Don't pay $5,997 for a course that teaches 1-minute EMA crossovers. You now know — from reading this book — that 1-minute EMA crossovers are mathematically unprofitable after spreads. Anyone selling a course on this strategy either doesn't know the math (incompetent) or does know the math (dishonest). Neither one deserves your money.
Don't revenge trade. You know what revenge trading is. You take a loss, you get angry, you jump back in with a bigger position to "make it back." This is not a trading strategy. This is an emotional response. It is the single fastest way to destroy an account, and it's the reason most blown accounts blow. If you catch yourself doing this, close the platform. Go outside. The market will be there tomorrow.
Don't trade with money you need. If losing your trading capital means you can't make rent, you should not be trading. Full stop. Trading capital is money you can lose entirely — every cent of it — and your life doesn't change. If that's 200 euro, trade 200 euro. If that's zero, don't trade. Save until you can afford to lose something.
The Way Out Is Boring
Here's the truth that no trading influencer will ever tell you, because it doesn't sell courses and it doesn't get views.
The way out is boring.
It's a daily chart. It's one trade every few days. It's checking your phone once a morning while the coffee brews. It's trailing stops and half-Kelly position sizing and a strategy you've validated against ten million candles of historical data. It's 13 euro a month turning into 30 euro a month turning into 100 euro a month over years — not weeks, not months, years.
It's building something slowly, unglamorously, without telling anyone about it, because there's nothing to brag about. There's no screenshot of a 400% day. There's no "I turned 500 euro into 50,000 euro" story. There's just a line on a chart going gradually upward, with the occasional dip, and a boring notification once a day that says your system triggered a trade.
It's not a life transformation. It's a hobby that pays.
And if you combine it with a prop firm account, it's a hobby that pays a little better. And if you combine it with a real career and real income and real savings, it's a piece of a larger financial picture that, over time, adds up to something meaningful.
That's the way out. That's what ten million candles and 600 strategy tests and weeks of intensive research taught me.
The market isn't your enemy. The system isn't your friend. The math is the math. And the only people who survive long-term are the ones who learned to work with all three.
I started this book talking about candles. I want to end this section by talking about time.
Time is the most undervalued asset in trading. Not capital. Not strategy. Not indicators. Time. The time to wait for a good setup. The time to let a trade run. The time to compound small gains. The time to sit out when the market isn't offering you anything worth taking.
Every advantage the institutions have can be summarized as money. They have more money for better spreads, more money for faster servers, more money for better data.
The one advantage we have can be summarized as time. We have more time to wait.
Use it.
Epilogue: The €526 Account
I just checked. It's still there.
€526.18, sitting in an Oanda account I opened with the nervous energy of a man who'd watched one too many YouTube videos about financial freedom. The balance hasn't moved. Not a cent up, not a cent down. No open positions. No pending orders. No trailing stops doing their patient work while I sleep.
Nothing.
And for the first time in this entire journey, that feels like the smartest decision I've ever made.
Let me tell you what I thought would happen. I thought I'd open this account, learn a few patterns, maybe follow some signals, and within six months I'd be scaling up. A thousand euros. Five thousand. Maybe quit the day job by year two if things went well. I'd read the stories. I'd seen the screenshots. I'd done the napkin math — if you can make just 2% a day, compounded over a year, that's...
I'll stop you right there. I ran that calculation properly somewhere around Chapter 4. The number is hilarious. And impossible. And the reason it's impossible is the entire point of this book.
I started this project wanting to get rich quick. I'm ending it knowing exactly why that phrase exists: because it's the most profitable lie in finance. Not profitable for the person who believes it. Profitable for everyone selling it.
What I built instead was something I never planned. Six hundred trading strategies. Five instruments. Ten million candles of real market data from a real broker's price feed, with real spreads baked in. Timeframes from one-minute bars — where hope goes to evaporate — all the way up to monthly charts, where something resembling an actual edge occasionally, grudgingly, reveals itself.
No retail trader I know of has done this. Not because it's genius-level work. It's not. It's tedious, methodical, unglamorous work. The kind of work that doesn't photograph well for Instagram. You can't pose in front of a for-loop. Nobody's filming a TikTok about optimizing Sharpe ratios at two in the morning while your girlfriend asks why you're still awake. The reason no retail trader does this is because the results are inconvenient. They don't confirm the fantasy. They dismantle it, piece by piece, with the cold indifference of a spreadsheet that doesn't care about your dreams.
Here's what I found, stripped to its bones: the game is rigged at short timeframes. Not rigged like a conspiracy — I'm not wearing a tinfoil hat. Rigged like a casino. The math simply doesn't work in your favor when you're trading one-minute or five-minute bars. The spread alone eats you alive. You're not trading against the market; you're trading against the cost of participation. And on a one-minute chart, that cost is a tax on every single decision you make, sixty times an hour, for as long as you can stand to sit there.
The only edge I found — the only consistent, repeatable, statistically defensible edge in 600 strategies across 10 million candles — is patience. Daily charts. Weekly charts. Letting trades breathe. Accepting boredom as a feature, not a bug. It's not sexy. It will never sell a course. But it's real.
I learned more from not trading than most traders learn from years of losing. That's not a motivational poster. That's a data-driven conclusion from weeks of intensive research that I wouldn't wish on anyone's social life.
I checked in with my friend recently. The one from Chapter 1. The one with the Telegram signals group that cost €49 a month and promised 80% win rates. He'd moved on. First to crypto — bought near the top, held through the crash, told himself he was in it for the tech. Then NFTs — minted something, tried to flip it, learned that a JPEG of a bored primate is only worth what the next sucker will pay. Then AI trading bots. Some kid on Twitter promised a neural network that could predict EUR/USD moves with 94% accuracy. It couldn't. Neural networks are very good at many things. Predicting what millions of panicking humans will do with leveraged currency positions is not one of them.
Last I heard, he was considering a prop firm challenge. Pay €500 for the chance to prove you can trade someone else's money, under rules so tight that a single bad day ends the whole thing. He asked what I thought.
I told him I'd run the numbers.
He hasn't called back yet.
The Instagram guru — the one who got me curious in the first place, the one with the Lamborghini and the Dubai Marina apartment and the casually open laptop showing a six-figure trading account — he deleted his profile. Or maybe Instagram deleted it for him. Either way, he's gone.
Somebody on Reddit did the detective work. The Lamborghini was rented. Hourly rate, photographed from every conceivable angle in a single afternoon to create six months of content. The Dubai apartment was an Airbnb. A nice one, I'll give him that. The kind with floor-to-ceiling windows that make everything behind you look like success. The trading account was real, technically — funded by course sales, not by trading. Always was. The P&L that impressed me at the beginning of this journey was just revenue from selling the dream to people like me.
I'm not even angry. You can't be angry at a magic trick once you've seen the wires. You just feel a bit foolish for clapping.
So what now?
My €526 is still there. But the difference between me before this project and me today is that now I know exactly what to do with it.
One trade every ten days or so. Maybe fewer. Daily charts only. Trend following with trailing stops, because the data says mean reversion is a fairy tale below the weekly timeframe. Position sizing that risks 5% per trade — the same percentage we used in the backtesting. It's aggressive, but with a validated daily-timeframe strategy and trailing stops, the math supports it. Lower risk means lower returns; higher risk means the drawdowns will test your nerve. Five percent is the sweet spot our data pointed to. I've seen what happens to accounts that risk 10% — they die, reliably, within a few months. I've got the equity curves to prove it. They all look the same. A brief, exciting rise, a plateau that feels like consolidation, and then a cliff.
My approach won't make me rich this year. It probably won't make me rich next year either. It might, over a very long time horizon, with compounding and discipline and the kind of patience that most people mistake for doing nothing, generate returns that modestly beat a savings account. That's it. That's the honest answer. The one nobody selling you a €997 masterclass will ever give you.
But here's what it won't do: it won't make me poor. It won't blow up my account. It won't send me chasing losses at 3 AM on a leveraged position I should never have opened. It won't fund someone else's rented Lamborghini.
And in a game where 75% of retail players lose everything — where the brokers are legally required to publish that statistic and people sign up anyway, as if they're reading it the way a lottery player reads the odds, with the quiet conviction that it applies to everyone except them — not losing is its own kind of winning.
I have a €526 account, 600 tested strategies, 10 million candles worth of evidence, and the rarest thing in retail trading:
A plan I actually trust.
Because I built it myself.
The best trade I ever made was the one I didn't.